Environmental Investment
In 2024, YFY invested NT$319 million in environmental protection, focusing on air quality, water, waste, energy, etc. Future efforts will target energy conservation, carbon reduction, renewable energy transformation, and increased green product production.
Unit: TWD
| Category | 2022 | 2023 | 2024 | Included Projects |
| Energy | 17,000,000 | 414,000,000 | 108,372,731 | Capital expenditures related to sustainable biofuels and energy management, including the installation of fuel storage tanks and feed systems, the addition of processing lines and equipment, and improvements to motors, pumps, compressed air, steam, and fuel tank systems. |
| Waste Disposal | 28,000,000 | 11,000,000 | 1,579,117 | Capital expenditures related to waste collection, recovery and recycling, including activities such as the purchase of facility equipment and the establishment of pilot lines. |
| Air Quality | 148,000,000 | 42,000,000 | 154,045,654 | Capital expenditures related to the reduction and prevention of air pollution, including activities such as installing air pollution control equipment, upgrading dust collection systems, and improving digester tank covers. |
| Wastewater Treatment | 104,000,000 | 34,000,000 | 11,427,300 | Capital expenditures related to wastewater treatment, including activities such as sewage pipeline upgrades and the installation of cooling towers after the anaerobic system. |
| Water Treatment | 4,228,337 | Capital expenditures related to water treatment, including activities such as replacing circulation pumps, installing clean water filtration systems, and adding water recycling systems. | ||
| Others | 2,000,000 | 15,000,000 | 39,957,698 | Capital expenditures for spare parts procurement, roof repairs, purchase of surveillance cameras, pipeline replacements, etc. |
| Total | 299,000,000 | 516,000,000 | 319,610,837 | - |
| % of production sites covered | 100 | 100 | 100 | - |
Biodiversity
Biodiversity Risk Assessment
YFY has established an integrated framework spanning from the Group level to individual sites, and from in-house operations to the supply chain. This framework is built on the Board-supervised ESG and risk management structure, the Group’s Environmental Policy (including biodiversity and forest conservation), ISO 14001 site-level risk assessments, FSC/PEFC certifications, and the Supplier Code of Conduct (with biodiversity provisions). In addition, YFY discloses hydrological risk scenarios and sensitive habitat case studies as practical evidence.
Process Description
Board-Supervised Group Risk Management and ESG Governance
YFY has established a Board-level Sustainable Development Committee, under which task forces on Environmental Sustainability and Risk Management operate. Environmental risks—including those related to nature and biodiversity—are incorporated into the annual risk inventory and the Company’s overall risk management procedures through risk identification, probability/impact assessment, and mitigation planning. In 2024, a total of 66 risks were identified, forming the basis for control priorities in the following year. This governance structure provides a systematic mechanism for identifying biodiversity dependencies and impact-related risks.
Environmental Policy (Including Biodiversity and Forest Conservation) + Pre-M&A Environmental Review
The Group’s Environmental Policy explicitly commits to biodiversity and forest conservation. In addition, environmental impact assessments are integrated into due diligence for major investments and acquisitions, enabling the early identification of nature- and biodiversity-related risks.
Site-Level Risk Identification Driven by ISO 14001 and Other Management Systems
Each manufacturing site conducts risk identification, assessment, and control for issues such as water resources, emissions, and land use under the ISO 14001 “risks and opportunities” framework. The Company discloses that most plants are located outside protected areas and outlines management principles for operations under water risk scenarios, including discharge destinations and compliance standards.
Upstream Raw Materials and Supply Chain Due Diligence (Avoiding Deforestation and Ecological Damage)
1.The Supplier Code of Conduct includes biodiversity as a mandatory requirement: suppliers must comply with biodiversity-related laws, avoid deforestation, and participate in ecosystem conservation.
2.The Group promotes FSC/PEFC certification of responsible forest products to reduce potential impacts from the sourcing of logs, wood chips, and pulp in ecologically sensitive areas.
Forest and Habitat Management with External Collaboration (Forest, Pulp & Paper Business Group)
Chung Hwa Pulp manages company-owned and operated forests in Taiwan, establishing nature reserves and native plant gardens. In partnership with research institutions, the company undertakes long-term efforts to restore native species and conserve habitats, adopting localized management practices to minimize risks to ecologically valuable areas.
Scope of Biodiversity Risk Assessment
Organizational Boundaries / Site Coverage
The Group’s environmental management, performance, and risk information are organized by its three major business groups—Forest, Pulp & Paper, Containerboard & Packaging, and Consumer Products—covering key production bases in Taiwan, China, and Vietnam. Issues such as water management and emissions are implemented and disclosed at the site level under the ISO 14001 framework.
Supply Chain Scope
Through the biodiversity provisions of the Supplier Code of Conduct and sustainable procurement requirements, YFY extends nature- and biodiversity-related risk management to upstream suppliers and their supply chains.
Sites Near Specific Habitats / Protected Areas
Operations located near forests (including designated nature reserves) and wetlands—such as the Kaohsiung Old Railway Bridge Wetland water supply case—are considered location-sensitive. The Company applies more stringent management and monitoring practices to mitigate potential impacts.
Risks Identified
Water Resource Dependency and Hydrological Sensitivity (Dependency)
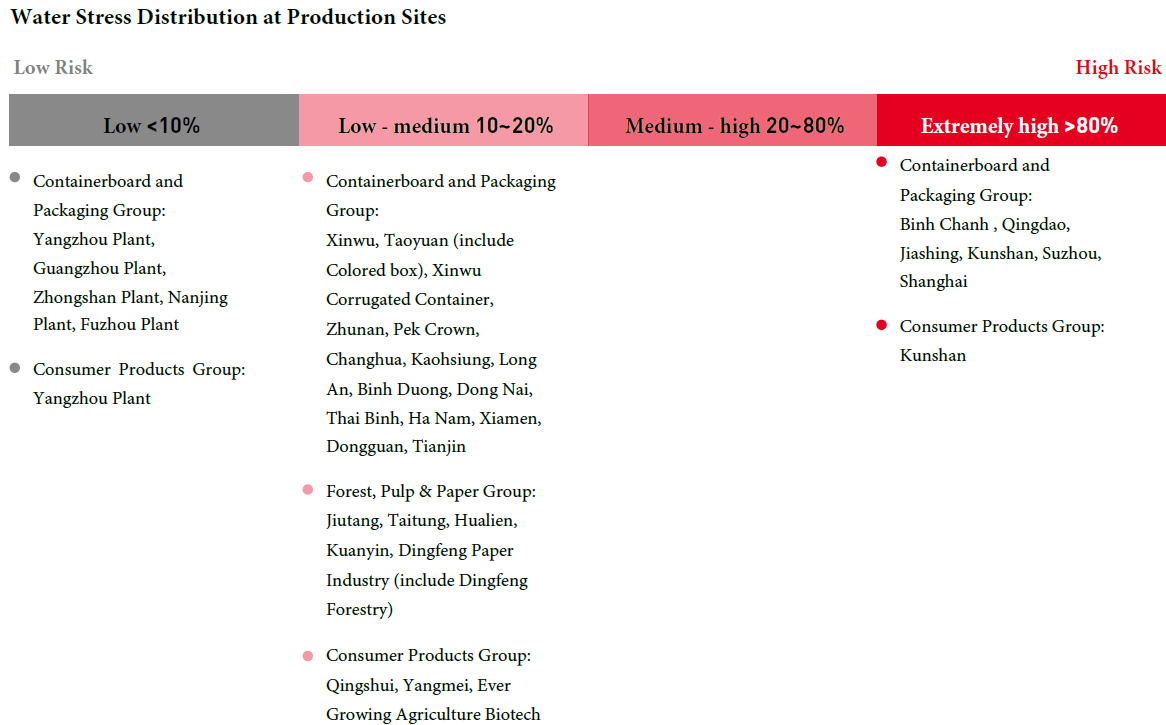
In line with ISO 14001, the Company conducts water risk assessments. By 2030, seven sites—mostly corrugated box plants with relatively low unit water use—are projected to be located in areas of extremely high water stress. The Company also discloses site-level water management and discharge pathways (initial in-plant treatment, followed by industrial park system treatment, and final release into natural water bodies), reflecting operational dependence on freshwater supply and the assimilative capacity of water systems.
Potential Impact of Process Discharges on Water Bodies and Habitats (Impact)
The Company outlines discharge standards and treatment processes, citing the Kaohsiung Old Railway Bridge Wetland as an example where stable water supply supports wetland ecosystems, providing habitats for birds and wildlife and fostering biodiversity—demonstrating the potential for positive habitat management outcomes.
Land Use / Forest Conversion Risks from Raw Material (Fiber) Sourcing (Impact)
Through FSC/PEFC-certified procurement and supplier commitments to avoiding deforestation, the Company reduces the risk of ecological impacts in High Conservation Value (HCV) forests and High Carbon Stock (HCS) landscapes.
Habitat Disturbance Risks from Forest Management (Impact)
In Taiwan, Chung Hwa Pulp manages forests by establishing nature reserves and native plant gardens, collaborating with research institutions, and optimizing forest structures. These measures mitigate impacts on sensitive species and habitats while long-term monitoring and restoration enhance ecosystem quality.
Company-Level Integration of Environmental and Operational Risks
The Risk Management Team and Environmental Sustainability Task Force conduct annual rolling assessments of environmental (including nature-related) risks, incorporating them into the Company’s overall risk register and control priorities.
Biodiversity Commitment
YFY publicly discloses a group Environmental Policy that includes a commitment to maintain biodiversity and forest conservation, and it extends biodiversity expectations to suppliers—publicly available and governed at the Board level via a Chairperson-led committee.
Policy or Commitment Aspects
Biodiversity and forest conservation embedded in YFY’s Environmental Policy
YFY’s group Environmental Policy commits to “maintain biodiversity and forest conservation,” alongside pollution prevention, target-setting, continual improvement, supplier collaboration across the value chain, and environmental impact assessment in M&A due diligence. These elements constitute an explicit, public commitment relevant to biodiversity risk management.
Supply-chain commitment: Biodiversity clause and no-deforestation requirement for suppliers
YFY’s Supplier Corporate Social Responsibility Code of Conduct requires suppliers to comply with biodiversity laws, minimize ecological impacts, refrain from deforestation, and engage in conservation of natural ecosystems, and to promote sustainable procurement within their own supply chains. This extends YFY’s biodiversity expectations across the upstream value chain.
Responsible fiber sourcing supports habitat protection
YFY discloses high use of recycled fiber and certification frameworks (FSC/PEFC) in purchasing, indicating a policy approach designed to reduce land-use change and forest-conversion risk linked to biodiversity loss.
Scope of Commitment
Operational scope: group-wide and multi-site
YFY applies environmental management and disclosure across its core business groups and operating geographies (Taiwan, China, Vietnam).
Value-chain scope: upstream suppliers and their supply chains
Through the Supplier Code’s biodiversity clause and sustainable-procurement requirement, YFY’s expectations apply to direct suppliers and cascade into suppliers’ own supply chains (traceability and sustainable sourcing actions).
Forestry/land stewardship examples in the group
Within the broader group, Chung Hwa Pulp publicly describes long-term management of native botanical gardens and nature reserves in eastern Taiwan in collaboration with universities/research institutes—illustrating location-specific stewardship relevant to biodiversity.
Policy Endorsement
YFY has elevated ESG to the Board level via the Sustainable Development Committee, chaired by the Chairperson and composed of directors/independent directors; the committee provides governance over ESG policies and monitors implementation. This governance structure indicates Board endorsement of ESG policies that include YFY’s Environmental Policy and biodiversity commitments.
No Deforestation Commitment
YFY publicly discloses a no-deforestation commitment via its Supplier Code, reinforces it with a group Environmental Policy (biodiversity & forest conservation), implements it through certified sourcing (FSC/PEFC) & green procurement, and places it under Board-level oversight by a Chairperson-led Sustainability Committee.
Extent of Policy or Commitment
Supplier Code – explicit no-deforestation clause
YFY requires suppliers to refrain from deforestation, comply with biodiversity laws, minimize ecological impacts, and engage in conservation of natural ecosystems (Biodiversity §5.9). This is an explicit, public no-deforestation commitment covering supplier conduct.
Environmental Policy – biodiversity & forest conservation
At group level, YFY’s Environmental Policy commits to “maintain biodiversity and forest conservation,” alongside pollution prevention, target-setting, supplier collaboration, and M&A environmental due diligence—providing policy context for avoiding forest conversion.
Responsible sourcing & monitoring through certification
YFY discloses high FSC/PEFC shares for woodchips and imported pulp, and ongoing green procurement—mechanisms that operationalize no-deforestation intent in high-risk commodities.
Scope of Commitment
Value chain scope (upstream suppliers and their supply chains)
The Supplier Code applies to all suppliers and asks them to push sustainable procurement within their own supply chains, extending no-deforestation expectations beyond Tier-1. As of 2024, YFY reports 1,090 suppliers signed the commitment.
Operational scope (group-wide)
YFY’s Environmental Policy covers the group’s business units and sites (Taiwan, China, Vietnam), linking policy and procurement practices to all relevant activities.
Commodity scope
Public disclosures explicitly address forest-risk materials (woodchips, pulp, raw paper, cardboard) and high recycled content—aligning operationally with no-deforestation objectives.
Policy Endorsement
YFY’s Sustainable Development Committee is a board-level functional committee chaired by the Chairperson; ESG working groups report to it at least twice a year. This structure indicates board oversight of ESG policies including the environmental and supplier codes encompassing no-deforestation.
Biodiversity Mitigating Actions
YFY publicly demonstrates Avoid–Reduce–Regenerate–Restore–Transform biodiversity actions across siting, due-diligence, high recycled/certified sourcing, site-level water reuse and treatment, wetland regeneration/restoration programs, supply-chain enforcement (no-deforestation), and board-level governance to drive ongoing transformation.
Avoid
Avoid Environmental Impacts
We protect biodiversity, peatlands, high carbon stock forests, high conservation value areas, and endangered forests. We ensure that no raw materials or pulp are sourced from ancient or endangered forests (e.g., boreal forests in Canada and Russia, coastal temperate rainforests, tropical forests and peatlands in Indonesia, Southeast Asia, the Amazon, and Africa). Our operations are not located in peatlands or habitats of endangered species.
Siting & hydrology screening to avoid sensitive areas
YFY discloses that production sites (including those in higher-water-stress areas) are located in non-protected, non-agricultural zones with legally obtained water rights; discharge follows industrial-park systems or replenishes wetlands where appropriate.
Pre-M&A environmental due diligence
The Group Environmental Policy requires environmental impact assessments in M&A due-diligence to identify nature/biodiversity risks early.
No-deforestation requirement for suppliers + certified sourcing
Supplier Code includes a “refrain from deforestation” clause; procurement emphasizes FSC/PEFC to avoid forest-conversion risks.
Reduce
Water-risk planning & usage alignment
Sites projected in extremely high water stress by 2030 are mainly corrugated container plants with lower water withdrawal/consumption, sited in planned industrial zones with water use aligned to plans.
High reuse & process recirculation
YFY reports >90% process-water reuse, multi-stage treatment, and 24/7 monitoring to reduce impacts on receiving waters.
Material circularity to cut land-use pressure
In 2024, 95% of the materials YFY used for products and packaging came from renewable sources; Containerboard and Packaging Group used >90% recycled pulp; 98% of raw materials procured by YFY Procurement Department were FSC/PEFC certified—reducing demand for virgin fiber.
Site management systems
ISO 14001-based site risk identification and controls across the network.
Regenerate
Wetland hydrology support (baseflow)
For ~20 years, treated effluent from YFY’s Jiutang plant has sustained baseflow to the Old Railway Bridge Wetland (Kaohsiung), maintaining ecological functions and habitat.
Carbon sequestration enhancement program (science-based)
In 2025 YFY signed an MOU with Kaohsiung City and Taiwan’s Water Resources Agency to launch a wetland carbon sequestration enhancement initiative (baseline monitoring → planting native aquatic grasses → quantify sequestration).
Restore
Habitat restoration & stewardship at the Old Railway Bridge Wetland
Volunteer days, invasive-plant biomass reuse (e.g., “grass walls”), indicator species recovery (e.g., Pheasant-tailed Jacana) and regular desilting/drainage maintenance.
Operational design that prioritizes ecosystem recovery
We state that, where wetlands are the receiving environment, treated water is used to replenish wetlands for ecological conservation.
Forest habitat restoration by affiliate
Chung Hwa Pulp manages native botanical gardens and a nature reserve in eastern Taiwan with university/ institute partners.
Transform
Group-level strategy shift (saccharide economy & circular economy)
YFY’s Environmental Policy embeds saccharide economy, circular economy, digitization, and supply-chain management as strategic levers—re-orienting materials and products away from fossil-based inputs and toward renewable/recycled fibers.
Value-chain mobilization & compliance
1,090 suppliers (end-2024) signed the Supplier Code; biodiversity/no-deforestation and water-management requirements cascade into suppliers’ own supply chains.
Board-level governance drives nature-related actions
The Sustainable Development Committee, chaired by the Chairperson, meets/receives biannual reports and oversees ESG risk management—supporting organization-wide shifts on nature/biodiversity.
Certificates and Standards
| Plant | ISO 9001 | ISO 14001 | ISO 45001 | FSC CoC |
| Containerboard and Packaging Group | ||||
| Xinwu | 2023/07 | 2023/07 | 2022/08 | 2030/02 |
| Xinwu Corrugated Container | 2026/10 | 2026/10 | 2026/10 | 2030/02 |
| Taoyuan (include Colored box)* |
Taoyuan:2024/09 Colored box:2026/05 |
2025/10 | 2025/11 | 2030/02 |
| Zhunan | 2025/03 | 2026/06 | 2027/03 | 2030/02 |
| Pek Crown | 2026/12 | 2027/01 | 2027/01 | 2030/02 |
| Changhua | 2025/08 | 2024/08 | 2025/11 | 2030/02 |
| Kaohsiung | 2026/10 | 2025/11 | 2025/11 | 2030/02 |
| Yangzhou | 2026/12 | 2027/01 | 2026/09 | 2025/02 |
| Tianjin | 2024/12 | 2024/12 | 2024/12 | 2024/12 |
| Qingdao | 2025/03 | 2025/03 | 2025/03 | 2028/11 |
| Nanjing | 2026/10 | 2025/10 | 2025/10 | 2028/06 |
| Shanghai | 2026/04 | 2026/04 | 2026/05 | 2026/08 |
| Suzhou | 2025/03 | 2025/03 | 2026/12 | 2025/05 |
| Kunshan | 2026/06 | 2026/06 | 2026/06 | 2024/07 |
| Jiashing | 2024/08 | 2024/08 | 2027/03 | 2025/12 |
| Fuzhou | 2026/03 | 2026/03 | 2026/03 | 2025/06 |
| Xiamen | 2026/01 | 2026/01 | 2024/12 | 2025/06 |
| Dongguan | 2025/12 | 2025/12 | 2025/12 | 2025/09 |
| Guangzhou | 2025/08 | 2025/08 | 2025/08 | 2024/11 |
| Zhongshan | 2025/12 | 2025/12 | 2027/02 | 2028/01 |
| Ha Nam | 2025/05 | 2025/05 | 2025/05 | 2024/08 |
| Binh Duong | 2026/02 | 2026/02 | 2026/03 | 2027/09 |
| Dong Nai | 2027/03 | 2027/03 | 2027/02 | 2025/09 |
| Long An | 2027/03 | 2027/03 | 2027/02 | 2025/09 |
| Consumer Products Group | ||||
| Yangmei | 2026/09 | 2025/11 | 2027/01 | 2024/07 |
| Qingshui | 2026/05 | 2025/03 | 2025/02 | 2024/07 |
| Ever Growing | 2025/02 | 2026/10 | - | - |
| Yangzhou | 2026/08 | 2026/08 | 2026/08 | 2024/12 |
| Kunshan | 2026/11 | 2026/11 | 2026/11 | 2028/01 |
| Forest Products and Fine Paper Group | ||||
| Hualien | 2026/05 | 2025/04 | 2024/06 | 2028/08 |
| Taitung | 2026/12 | 2025/12 | 2025/12 | 2028/10 |
| Jiutang | 2025/05 | 2026/06 | 2026/06 | 2027/12 |
| Kuanyin | 2025/05 | 2025/05 | - | 2028/09 |
| Dingfung | 2026/07 | 2026/08 | - | 2027/02 |
* The ISO 14001 certification only covers the Taoyuan Plant, whereas the ISO 45001 and FSC certifications encompass both the Taoyuan Plant and the Colored Box plants.
| Certification and Certificate Name |
Production Sites and Validity
|
| ISO 14064-1/CNS, 14064-1/ Greenhouse Gas Emissions Verification Statement (updated annually) | Kuanyin、Hualien、Taitung、Jiutang、Dingfung、Xinwu、Taoyuan、Pek Crown、Changhua、Yangzhou、Qingshui、Yangmei、Ever Growing、Yangzho Mill、Kunshan Mill |
| ISO 14067/ Carbon footprint verification statements | Hualien Plant -Paper Star Plain Paper (2025/09) Xinwu Plant -M0(2025/01)、A0(2025/01)、BL(2025/01)、B4(2025/7)、BM(2025/7)、W2(2025/7)、W4(2025/7) Kaohsiung Plant - CSH(2025/02) Yangzhou Plant-BJ Cardboard (2024/05) Qingshui Plant- Mayflower Shumin thick stick removable toilet paper 86 pumping (2025/12) Yangmei Plant - Mayflower Ultimate Interfold Toilet Paper 94 pumping (2025/12) Ever Growing Plant - Orange House Nature Concentrate Laundry Detergent-Anti Bacterial 1800ml(2025/12) |
| ISO 50001 Energy Management System | Xinwu (2027/03)、Yangmei (2024/12)、Qingshui (2024/12)、Jiutang (2026/12)、Taitung (2026/11)、Yangzhou (2027/03)、Dong Nai (2026/12) |
| PEFC Certification | Hualien (2025/09)、Yangzho Mill (2028/01) |
*The ISO 14064-1 certifications encompass both the Taoyuan Plant and the Colored Box plants.

