Sustainable Circularity: Building a Regenerative Value Chain through the Saccharide Economy
Faced with climate change, resource depletion and natural capital risks, global environmental governance has progressively expanded from carbon emissions management alone to an integrated transition encompassing the Energy Transition, resource circularity, the bioeconomy, natural carbon sinks and climate resilience. YFY places Sustainable Circularity at the core of its environmental strategy and, starting from plant fibers and renewable resources, continues to explore the Saccharide Economy – renewable, circular, convertible and able to return to nature – in order to reduce dependence on petrochemical resources and fossil energy.
Saccharides originate from photosynthesis and are an essential basis for wood, paper, fibers and bio-based materials. Since its founding, YFY has continuously reintroduced agricultural by-products, recovered fiber, water resources and production residuals into its production and energy systems, and has further developed low-carbon materials, bioenergy, smart energy and carbon management technologies, extending "circularity" from a mode of resource use into materials, energy and industrial value creation. In response to global net-zero, bioeconomy and circular-industry trends, the Company will continue to build on plant fibers, regenerated fibers and agricultural and forestry resources to connect forest carbon sinks, low-carbon materials, resource circularity, the Energy Transition and climate technology.
Regenerative Value Chain
YFY extends environmental management beyond individual production sites – upstream to raw materials and the supply chain, and downstream to products and resource regeneration – building a regenerative value chain of Source – Transformation – Regeneration that reduces environmental impacts across the full value chain through three dimensions: responsible sourcing, efficient low-carbon transformation and circular regeneration.
Regenerative Value Chain
Key Performance
2025 Quantified Results
Performance Notes
1. Responsible Sourcing
Responsible wood fiber procurement
Wood fiber sourced: 2.407 million metric tons
Certified or from controlled sources: 41.4%
Forest certification and controlled-source management under FSC CoC, PEFC and FSC CW strengthen traceability across the wood fiber supply chain.
Certification of key raw materials
Imported pulp certified: 100%
Wood chips in Taiwan certified: 95.7%
Raw-material certification coverage continues to increase in response to international supply chain due diligence and forest risk management requirements such as the EUDR.
Circular and green procurement
Recovered fiber: 1.649 million metric tons
Green procurement: NT$10.3 billion
Local suppliers by number: 93%
A dual-track approach combining forest certification and recovered fiber advances responsible sourcing while balancing resource circularity, local supply and raw-material resilience.
Supplier ESG management
More than 2,000 suppliers signed the Code of Conduct
1,018 suppliers evaluated, Grade C: 0
100% of new suppliers signed the Code of Conduct, and no high-risk suppliers requiring immediate improvement were identified in the evaluations, strengthening supply chain resilience.
2. Low-Carbon Transition
Energy autonomy and low-carbon transition
Internally generated energy: 31.14 million GJ
Biomass: 26.7%
Alternative fuels: 9.5%
Greater energy autonomy reduces dependence on the external grid and strengthens operational resilience to energy price volatility and supply risk.
Water resource risk management
Total water withdrawal: 47,256 million liters
Paper-mill water recycling rate: above 90%
Withdrawals in high water-stress areas: 0.24%
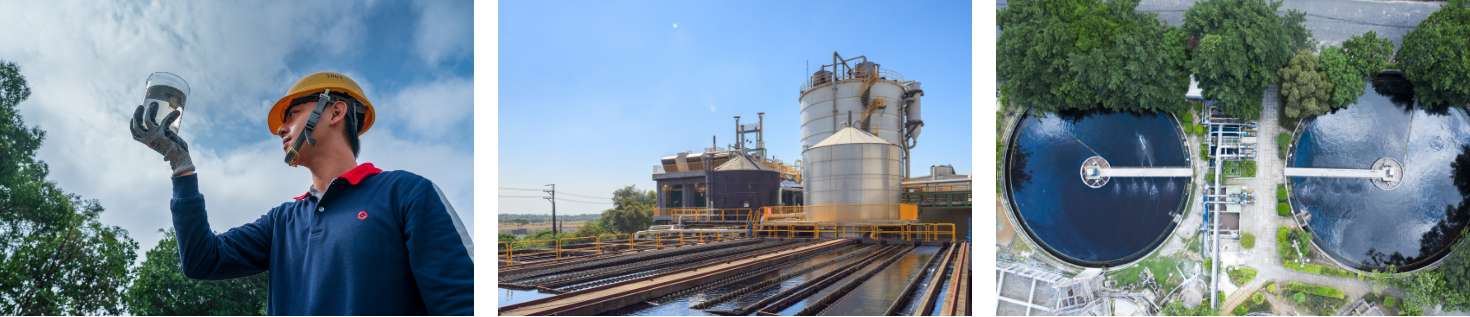
A high water-recycling rate and low exposure in water-stressed areas reduce operational water risk and enhance water resource resilience.
Air pollutant management
NOx: 770 metric tons
SOx: 649 metric tons
PM: 208 metric tons
Continued investment in pollution-control equipment and process improvement reduces emissions of major air pollutants and the environmental impact of manufacturing.
3. Circular Regeneration
Waste-to-resource conversion
Total waste generated: 569,000 metric tons
Recycled: approximately 535,000 metric tons
Waste-to-resource ratio: 94%
The waste-to-resource ratio already exceeds the 2026 target of 87%; waste reduction and circular use continue to be advanced.
Reducing direct disposal
Direct disposal down 14% YoY
Containerboard and Packaging Group in Taiwan and Vietnam waste-to-resource ratio: 99.1%
Process improvement, resource recovery and cross-plant circular use reduce final disposal requirements and improve resource efficiency.
Waste flow management
Waste flows 100% traceable
Management of qualified treatment providers, manifest reconciliation and destination checks establish a complete waste tracking mechanism, while production residuals are converted into alternative fuels and energy assets.
Circular Regeneration
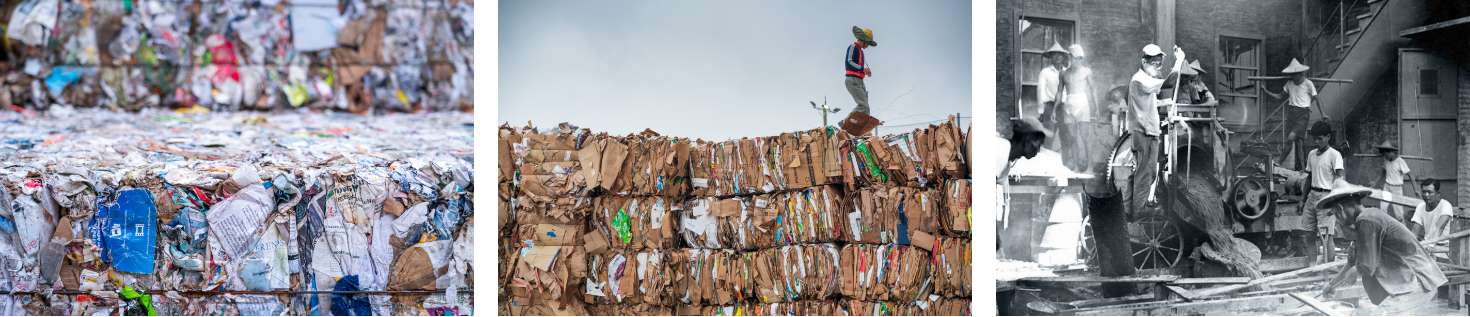
YFY treats the by-products and waste generated in its processes as resources that can be reused, continuously advancing reuse, recycling and energy recovery so that resources circulate within the production system. In 2025, total waste generated was approximately 569,000 metric tons, of which about 535,000 metric tons were recycled, giving an overall waste-to-resource ratio of 94% – above the 87% interim target for 2026. Direct disposal fell 14% from the prior year, and the Containerboard and Packaging Group's sites in Taiwan and Vietnam achieved a waste-to-resource ratio of 99.1%. Through the reuse of production residuals, the manufacture of alternative fuels and cross-plant resource circulation, the Company is progressively building a closed loop of production residuals – resource-recycling fuel – energy regeneration, converting materials that would otherwise require disposal into energy and production resources while reducing final disposal requirements and environmental burden.
From Carbon Reduction to Energy and Material Transition
YFY implements climate action in three main directions. On energy structure, biomass fuels, resource-recycling fuels, lower-carbon fuels and renewable energy reduce dependence on fossil fuels. On processes, the Company continues to advance equipment replacement, energy management, compressed-air and steam-system improvements, residual-heat recovery and smart energy saving. On transformative R&D, it is further developing carbon management platforms, low-carbon and non-plastic materials, product carbon management and climate technology applications.
On the materials side, the Company continues to advance replacing plastics with saccharides, developing renewable, circular and low-carbon materials from plant fibers and regenerated fibers. On the energy side, liquid, gaseous and solid energy technologies – lignin, biogas and resource-recycling fuels – reduce coal use, progressively converting long-accumulated Circular Economy capabilities into solutions for the Energy Transition and climate technology.
Environmental Targets and Continuous Improvement
With zero waste, zero emissions as its long-term vision, YFY continues to set quantified targets for greenhouse gases, energy, water resources and waste. In 2025, greenhouse gas emissions within the relevant Taiwan operating scope fell 19.9% from the 2021 base year; the annual electricity-saving rate at large production sites reached 2.3%; the alternative-energy input ratio across the three business groups reached 36%; the paper-mill water recycling rate exceeded 90%; and the waste-to-resource ratio reached 94%. Environmental performance continues to be advanced through management systems and investment plans.
Goals
Performance
Review and Planning
2030
2026
2025
2025
Toward net zero; reduce carbon emissions by 16% versus 2021 and continue reducing non-GHG emissions.
Total carbon emissions (Scope 1+2) down 9% versus 2021Note 1
-4%
-19.9%
Center on coal substitution; expand biomass fuels and resource-recycling fuels to replace coal, together with renewable energy. Continue plant energy-saving measures and energy-system risk management to improve energy efficiency, while continuing to implement Circular Economy initiatives and collaboration programs.
Substantially reduce fossil fuels and increase renewable energy use.
Average annual electricity-saving rate: 1.5%Note 2
1.5%
2.3%
Continue diversified green-energy development and equipment and system energy-saving measures, and continue increasing the share of alternative fuels; flexibly adjust self-use or trading according to renewable-energy market demand.
Total alternative energy (biomass + alternative fuels) input ratio above 35%
>35%
Three business groups 36% Taiwan 43.4%
Implement the Hydrologic Cycle; continuously increase the paper-mill water recycling rate and reduce water consumption per metric ton of paper.
Paper-mill water recycling rate above 85%
85%
>90%
Strengthen water-saving measures and the recovery, circulation and reuse of process water, and use anaerobic reaction systems to substantially reduce the organic content of process discharge water; develop product water-saving plans to reduce product water consumption.
In 2025, higher output at some sites increased process-water demand; in addition, inflows from nearby agricultural drainage caused larger fluctuations in withdrawal/discharge differences and water consumption at certain sites. Water resource management and monitoring will continue to be strengthened, with external inflows tracked and managed.
Total water consumption down 1% year on year
-1%
+103%
Practice the Circular Economy and zero waste, and reduce total waste.
Waste-to-resource ratio above 87%
>87%
94%
Increase the reuse of production residuals to manufacture alternative fuels, converting waste to energy, and continuously raise waste reuse and recycling.
Under Circular Economy principles, strengthen the management and control of production activities to reduce waste arising from waste and losses, use recyclable raw materials, redesign products for easier recovery and reuse, and track and properly treat waste flows.
Direct waste disposal down 1% year on yearNote 3
-1%
-14%
Note 1: Data scope covers all Taiwan production sites and the parent company listed under "Entities Included in the Report."
Note 2: Data scope covers the large Taiwan production sites listed under "Entities Included in the Report."
Note 3: Direct disposal includes waste disposed of by landfill, incineration and other treatment methods.
Environmental Investment
To accelerate the low-carbon transition and improve resource efficiency, YFY continued to expand its sustainability and environmental improvement investment in 2025, reaching NT$854 million for the year – the highest in four years – comprising NT$850.0 million in capital investment and NT$4.1 million in operating expenses. Compared with NT$297 million in 2022, NT$501 million in 2023 and NT$279 million in 2024, total environmental investment in 2025 more than tripled year on year and increased approximately 188% versus 2022, demonstrating a continued deepening of investment in environmental transition. These investments delivered NT$428.5 million in savings, cost avoidance and carbon fee reductions in 2025, equivalent to approximately 50% of total environmental expenditure. The focus of investment has also progressively extended from pollution prevention to the Energy Transition and carbon reduction, including energy and electricity saving, energy management, greenhouse gas reduction, renewable energy, water resource management, waste-to-resource conversion and natural ecological conservation. Looking ahead, the Company will continue to reduce the environmental impact of its operations through equipment upgrades, improved energy efficiency and renewable energy deployment, while strengthening the long-term competitiveness of green products and low-carbon processes.
Sustainable Investment
Unit: NT$100 million
Investment Category
Expense Category
2022
2023
2024
2025
Included Projects
Renewable Energy / Energy Technology
Capital
0.17
4.14
1.08
0.50
Continued investment in biomass energy, biogas power generation, and solar power to expand green electricity.
Operate
0.00
Energy Saving / Electricity Saving / Energy Management
Capital
3.91
Implemented energy management through equipment upgrades, system-level energy-saving measures, and residual-heat recovery.
Operate
0.01
Carbon Reduction / GHG Emissions Management
Capital
3.53
Improved energy efficiency and reduced emissions per unit of product.
Operate
0.01
Waste Reduction / Waste Recycling and Reuse
Capital
0.28
0.11
0.02
0.36
Promoted waste-to-resource conversion and waste reduction to reduce dependence on fossil fuels.
Operate
0.00
Water Conservation / Water Resource Management
Capital
1.04
0.34
0.04
0.11
Capital expenditures for water treatment, including circulation pump replacement, installation of clean-water filtration systems, and expansion of water-recycling systems.
Operate
0.01
Water Pollution Prevention
Capital
0.11
0.05
Improved process-water recycling through white-water reuse, additional reclaimed-water disinfection equipment, and by raising the biological-tank concentration at the wastewater treatment plant.
Operate
0.00
Air Pollution Control
Capital
1.48
0.42
1.54
0.04
Capital expenditures for air-pollution reduction and control, including new pollution-control equipment, dust-collection system upgrades, and digester-cover improvements.
Operate
0.00
Natural Ecology / Environmental Conservation
Capital
-
-
-
0.00
Worked with local governments to use plant discharge water of a quality better than regulatory standards to support natural ecosystems and create biodiversity.
Operate
0.02
Other
Capital
0.02
0.15
0.40
0.70
Capital expenditures for employee welfare and care, occupational safety and health, information security, quality management, automation, and digital transformation.
Operate
0.37
Total
2.99
5.16
3.19
9.61
-
Operating-Site Coverage (%)
100
100
100
100
-
Environmental Management and Verification
YFY strengthens environmental governance through international management standards and third-party verification. In 2025, ISO 14001 environmental management system certification coverage reached 94%, and eight production sites across Taiwan, Mainland China and Vietnam obtained ISO 50001 energy management system certification. The parent company and all production sites completed greenhouse gas inventories, with approximately 90% of emissions receiving third-party verification. In addition, product carbon-footprint inventories were completed and third-party verified for 12 products under ISO 14067 or other relevant standards. Combining systems including FSC-CoC, PEFC, ISO 9001, BS 8001 and ISO 13065, the Company has established a foundation for environmental and quality management spanning raw materials, energy, processes and products, enabling environmental performance to improve continuously through institutionalized management, data tracking and external verification.
List of Plant Management System Certi cation
Production Site
ISO 9001 Quality Management System
ISO 14001 Environmental Management System
ISO 45001 Occupational Health and Safety Management System
FSC Certification
Containerboard and Packaging Group
Xinwu
2026/07
2026/07
2028/08
2030/02
Xinwu Corrugated Container
2026/10
2026/10
2026/10
2030/02
Taoyuan (incl. Colored Box)*
Taoyuan 2027/09 Colored Box 2029/05
2028/10
2028/11
2030/02
Zhunan
2028/03
2029/06
2027/03
2030/02
Pek Crown
2026/12
2027/01
2027/01
2030/02
Changhua
2028/08
2027/08
2028/11
2030/02
Kaohsiung
2026/10
2028/11
2028/11
2030/02
Yangzhou
2026/12
2027/01
2026/09
2030/02
Tianjin
2027/12
2027/12
2027/12
2027/12
Qingdao
2028/04
2028/04
2028/04
2028/11
Nanjing
2026/10
2028/10
2028/10
2028/08
Shanghai
2029/04
2029/04
2029/05
2029/08
Suzhou
2028/03
2028/03
2026/12
2028/04
Kunshan
2029/06
2029/06
2029/06
2028/06
Jiashing
2027/08
2027/08
2027/03
2030/12
Fuzhou
2029/03
2029/03
2029/03
2030/06
Xiamen
2029/01
2029/01
2027/12
2030/06
Dongguan
2028/12
2028/12
2028/12
2031/03
Guangzhou
2026/08
2026/08
2026/08
2029/11
Zhongshan
2028/12
2028/12
2027/02
2028/01
Ha Nam
2028/05
2028/05
2028/05
2029/08
Binh Duong
2029/02
2029/02
2029/03
2027/09
Dong Nai
2027/03
2027/03
2027/02
2030/09
Long An
2027/03
2027/03
2027/03
2030/09
Binh Chanh
-
-
-
-
Thai Binh
-
-
-
-
Consumer Products Group
Yangmei
2026/09
2028/11
2027/01
2029/07
Qingshui
2029/05
2028/03
2028/02
2029/07
Ever Growing
2028/02
2026/10
2028/02
-
Yangzhou
2026/08
2026/08
2026/08
2030/07
Kunshan
2026/11
2026/11
2026/11
2028/01
Forest, Pulp & Paper Group
Hualien
2029/05
2028/04
2027/06
2028/08
Taitung
2026/12
2028/12
2028/12
2028/10
Jiutang
2028/05
2029/06
2029/06
2027/12
Kuanyin
2028/05
2028/05
-
2028/09
Dingfeng
2026/07
2026/08
-
2027/02
* ISO 14001 certification covers the Taoyuan Plant only; ISO 45001 and FSC certifications cover both the Taoyuan Plant and Colored Box Plant.
ISO 14067 / Product Carbon Footprint Verification Statement
Hualien – Paper Star Copy Paper (2027/09); Biomass Green Electricity (2027/09) | Xinwu – Linerboard A0/BL/B4/BM; Corrugating Medium M0; white kraft paper W2/W4; Grey-backed Coated Board DM (2026/08) | Yangmei – Mayflower Ultra-Absorbent Folded Paper Towels, 200 Sheets (2026/10) | Ever Growing – Orange House Nature Concentrate Laundry Detergent-Anti Bacterial 1800 ml (2029/05)
ISO 50001 Energy Management System
Jiutang (2026/12); Taitung (2026/11); Xinwu (2027/03); Yangzhou (2027/03); Long An (2029/01); Dong Nai (2026/12); Qingshui (2027/12); Yangmei (2027/12)
PEFC Certification
Hualien (2030/09); Yangzhou (CPG) (2028/01)
Clean Water and Santation Clean Water and Santation
Affordable and Clean Energy Affordable and Clean Energy
Responsible Consumption and Production Responsible Consumption and Production
Climate Action Climate Action
Life on Land Life on Land
Partnerships for the Goals Partnerships for the Goals
Management Policy
Management Policy
Commit to taking into account environmental and ecological protection while developing the business. Regularly review regulations and trends. Continuously improve performance and management systems.
Take International standards such as ISO14001, 50001, as the management basis, and check through third-party verification and rolling corrections for continual improvement.
Actively develop and support the procurement of innovative energy and material design, develop the value of resources, and improve the efficiency of resource use to enhance the competitiveness of the company
Circular Raw Materials: Extending Resource and Biogenic Carbon Value
For more than a century, YFY has continued to place the circular economy at the core of its operations, promoting the sustainable use of resources from the raw-material stage. Wood chips, pulp, recovered paper, and base paper are among the Group's principal production inputs. Through the use of recycled fibers and paper recovery, materials are repeatedly reintroduced into production processes, extending material life cycles and reducing demand for virgin resources. In 2025, 96.5% of the raw materials used in products and packaging across YFY's three major business groups were renewable materials,of which recovered paper accounted for 36.2%. In the Containerboard and Packaging Business Group, more than 90% of the raw materials used in pulp production were sourced from recovered paper. By continuously strengthening paper-fiber circularity, YFY extends the value of biogenic carbon stored in fibers throughout the product life cycle.
Responsible Procurement: Building a Traceable and Sustainable Forest Supply Chain
YFY strengthens upstream raw-material governance through responsible procurement and traceability management, giving priority to raw materials verified by independent third parties and applying forest certification schemes such as FSC and PEFC to reduce risks associated with forest conversion and natural-resource use. In 2025, 95% of the raw materials procured by YFY were sourced from FSC- or PEFC-certified sources. Within CHP's Taiwan operations, 95.71% of purchased wood chips were certified, while certification coverage for imported pulp reached 100%. During the same year, green procurement of raw materials reached NT$10.3 billion, accounting for approximately 55% of total raw-material procurement, while the Group continued to explore opportunities to expand local sourcing. In addition, the Forestry, Pulp and Paper Business Group manages more than 30,000 hectares of plantation forests across Taiwan and China and continues to advance sustainable forestry practices and FSC Forest Management Certification. Through supplier no-deforestation requirements, certified raw-material procurement, and supply-chain traceability, YFY seeks to protect forests, biodiversity, and natural capital from the source.
To support sustainable consumption and production, YFY recognizes that responsible raw-material management is essential to maintaining long-term, circular, and sustainable operations. The Group gives priority to environmentally preferable products for raw materials, facility operations, and office supplies, including products carrying environmental labels, energy-efficiency labels, and FSC certification. In 2025, 95% of the raw materials procured by YFY were sourced from FSC- or PEFC-certified sources. In line with its green procurement principles, annual procurement of recycled fiber amounted to NT$10.3 billion, representing 55% of total procurement expenditure. Procurement practices are primarily aligned with each business group's commitments to the use of recycled fibers and internationally certified materials, the production of green products, and customer and consumer requirements, while appropriate risk controls are implemented throughout the process.
Maintaining Stable Circular Use of Key Paper-Fiber Raw Materials and Improving Resource Efficiency
Recent trends in the use of key paper-fiber raw materials show that YFY's consumption of virgin pulp/wood chips, recovered paper, and base paper for corrugated packaging has generally increased since 2022, with continued growth in 2023 and 2024 alongside business expansion. In 2025, total consumption of these three major raw-material categories was approximately 4.055 million metric tons, representing a slight decrease of approximately 1.7% from 2024, while the overall material mix remained stable. Recovered paper remained the largest category in 2025 at approximately 1.649 million metric tons, accounting for around 40.7% of the three major raw materials. Virgin pulp/wood chips accounted for approximately 1.224 million metric tons, while base paper for corrugated packaging accounted for approximately 1.183 million metric tons. By continuing to increase the use of recycled fibers, certified raw materials, and renewable materials, YFY is able to meet production needs while reducing reliance on virgin resources and improving overall material circularity.
Historical Use of Major Fiber-Based Raw Materials
Unit:Metric Tons
Materials
2022
2023
2024
2025
Raw Wood Pulp/Chips
692,419
1,271,755
1,313,312
1,223,730
Recycled Paper
1,460,045
1,646,731
1,667,286
1,648,658
Containerboard Paper for Packaging
814,984
930,807
1,146,303
1,183,110
Total
2,967,448
3,849,293
4,126,901
4,055,498
Greenhouse Gas Management
As the global transition to net zero accelerates, carbon pricing mechanisms expand, and Taiwan progressively implements carbon fees and emissions-control policies, greenhouse gas management has evolved from an environmental issue into a key business consideration affecting operating costs, capital allocation, energy strategy, and supply-chain competitiveness. YFY continues to monitor carbon emissions across its operating sites through GHG inventories, energy transition, process improvements, and digital carbon management. In line with its voluntary carbon-fee reduction plans and net-zero transition pathway, YFY has established short-, medium-, and long-term reduction targets, progressively decoupling production growth from carbon emissions and advancing toward net-zero emissions by 2050.
YFY Greenhouse Gas Reduction Strategy
YFY advances GHG reductions through three strategic pillars: Energy Structure, Process Optimization, and Transformative R&D. Under Energy Structure, YFY continues to expand the use of biomass fuels and resource-recycling fuels to reduce reliance on fossil fuels, while investing in renewable energy such as biomass energy, biogas power generation, and solar power. Process Optimization focuses on equipment replacement and upgrades, system-level energy efficiency, residual-heat recovery, and productivity improvements to reduce energy consumption and emissions per unit of product. Under Transformative R&D, YFY is introducing AI-enabled and digital management, renewable-energy and energy-storage systems, and carbon management accounts to monitor emissions at sites and production lines in real time. The Company is also advancing saccharide-based low-carbon materials, voluntary emissions-reduction projects, afforestation carbon-credit initiatives, and artificial-wetland reduction methodologies, while incorporating internal carbon pricing into low-carbon transition management.
Energy Structure
Process Optimization
Transformative R&D
Alternative Fuels
Renewable Electricity Development
Energy Efficiency & Equipment Replacement
Production Optimization
Digital Intelligence
Materials Innovation
Market Participation
Expand the use of biomass-based alternative fuels and resource-recycling fuels.
Promote waste recovery and reduction to reduce dependence on fossil fuels.
Continue investing in biomass energy, biogas power generation, and solar power to expand renewable electricity.
Strengthen energy management through equipment replacement and upgrades, system-level efficiency measures, and residual-heat recovery to reduce equipment energy consumption, improve energy efficiency, and lower emissions per unit of product.
Optimize the product mix and production-capacity allocation to improve production efficiency.
Invest in innovative low-carbon technologies to advance green and low-carbon production.
Introduce digital and AI-enabled management to improve production efficiency and product yield.
Deploy renewable-energy and energy-storage systems and participate in Taipower’s Supplemental Reserve to strengthen power-supply stability.
Establish carbon management accounts integrated with automated equipment to enable digital, real-time monitoring of carbon emissions across sites and production lines.
Develop diverse innovative paper-based materials and expand applications of saccharide-based materials.
Implement voluntary emissions-reduction projects, advance a Taiwan demonstration afforestation carbon-credit project, and develop an artificial-wetland emissions-reduction methodolo-gy.
Continue monitoring domestic and international trends and regulatory developments, while implementi-ng internal carbon pricing.
Greenhouse Gas Reduction Pathway
In response to Taiwan's carbon fee system, in 2025 YFY had seven entities subject to carbon fees in Taiwan, accounting for approximately 97% of YFY's total emissions in Taiwan. All seven entities submitted voluntary reduction plans for 2025–2030. Following review by the competent authority, two plants were approved for Preferential Rate A and five plants for Preferential Rate B, and all received carbon-fee preferential treatment for industries at high risk of carbon leakage. Key decarbonization measures include switching to low-carbon and biomass fuels, replacing and upgrading equipment, improving energy efficiency, introducing renewable energy such as solar power, and optimizing compressed-air, paper-machine, and steam systems.
In accordance with the designated GHG reduction targets for entities subject to carbon fees, YFY uses 2021 as the baseline year for its carbon-fee voluntary reduction plans; combined Scope 1 and Scope 2 emissions across Taiwan, Mainland China, and Vietnam were approximately 2.574 million metric tons CO₂e. Based on the commitments in each plant’s voluntary reduction plan, YFY has set targets to achieve a 16% reduction from the baseline year by 2030, a 50% reduction by 2040, and alignment with the national net-zero target by 2050.
Metric tons CO2e
2030 vs. 2021 16% reduction
-16%
2040 vs. 2021 50% reduction
-50%
2050 Net-Zero Emissions
Net Zero
2021 Baseline Year
2030 Short-Term Target
2040 Medium-Term Target
2050 Long-Term Target
Greenhouse Gas Emissions Trends and Reduction Performance
YFY defines its GHG inventory boundary using the operational control approach. Production sites across its three major business groups conduct annual GHG inventories in accordance with ISO 14064-1, the GHG Protocol, or applicable local requirements. The parent company, YFY Inc. (Head Office), introduced GHG inventory and verification in 2023 and completed the first-year GHG inventory for all consolidated subsidiaries in 2025, progressively establishing a carbon management foundation aligned with the financial reporting boundary.
In 2025, Scope 1 and Scope 2 emissions from the three major business groups across Taiwan, Mainland China, and Vietnam totaled approximately 2.33 million metric tons CO₂e, a 9.5% decrease from 2021. Scope 1 emissions decreased by 3.3% from 2024, mainly due to reduced coal use, increased use of alternative fuels and biomass energy, and transformation projects at selected sites. Market-based Scope 2 emissions remained broadly stable year on year.
Greenhouse Gas Emissions (Scopes 1+2)
Unit: tCO2e
2021
2022
2023
2024
2025
Scope 1
2,204,727
1,971,683
2,128,176
2,064,887
1,996,267
Scope 2 (Location Based)
369,564
429,658
366,429
332,245
332,069
Scope 2 (Market Based)
369,564
429,658
366,429
332,245
334,407
Total (Location Based)
2,574,291
2,401,341
2,494,605
2,379,132
2,328,336
Total (Market Based)
2,574,291
2,401,341
2,494,605
2,379,132
2,330,674
Data coverage (% of production sites)
97.1%
100%
100%
100%
100%
* Data Scope: Parent company (YFY Inc.) and all production sites listed in the “Entities Included in the Report.”
* Explanation of Emission Calculation:
- Methodology: Primarily follows ISO 14064-1 and the GHG Protocol; however, Yangzhou Plant adopts the “Accounting Guidelines for the Paper Industry” issued by China’s National Development and Reform Commission.
- Scopes: Disclosures are standardized to include Scope 1 and Scope 2. According to the Accounting Guidelines for the Paper Industry, Yangzhou Plant calculates five emission sources: fossil fuel combustion, industrial processes, wastewater treatment, net purchased electricity, and net purchased steam. The first three fall under Scope 1, while the latter two are classified under Scope 2.
- GWP Values: Parent Company adopts IPCC AR6, Taiwan plants adopt IPCC AR5 or AR6, mainland China plants adopt IPCC AR6 or Accounting Guidelines for the Paper Industry, and Vietnam plants adopt IPCC AR6.
* The Scope 2 location-based emissions for mainland China plants are estimated using the 2024 national average electricity carbon footprint factor of 0.5777 kgCO2e/kWh released by the Ministry of Ecology and Environment.
Of this total, Scope 1 and Scope 2 emissions in Taiwan totaled 1.336 million metric tons CO₂e in 2025, down 19.9% from 2021 and 5.1% from 2024; Scope 1 emissions were approximately 1.101 million metric tons CO₂e, accounting for about 82% of Taiwan emissions and arising mainly from the Forest, Pulp & Paper Group and the Containerboard and Packaging Group. With increased use of alternative fuels and biomass energy, Taiwan Scope 1 emissions in 2025 were 19.5% lower than in 2021; biogenic emissions totaled 753,000 metric tons CO₂e, approximately 8% higher than in the prior year.
Historical Scope 1 and Scope 2 GHG Emissions (Taiwan)
Scope 2 (metric tons CO2e)
Scope 1 (metric tons CO2e)
GHG Emissions Intensity per Unit Revenue(metric tons CO2e / NT$ million revenue)
19.6
18.6
20.3
18.0
18.1
1,667,799
18%
82%
2021
1,485,011
21%
79%
2022
1,501,141
18%
82%
2023
1,408,093
18%
82%
2024
1,336,181
18%
82%
2025
2025 GHG Emissions (Taiwan)
Consumer Products Group
Parent Company 0%
1,336,181 Metric tons CO2e
53%
40%
7%
Containerboard and Packaging Group
Forest, Pulp & Paper Group
* GHG emissions intensity per unit of revenue is calculated as Taiwan Scope 1 and Scope 2 emissions divided by YFY consolidated revenue for the same year.
In 2025, GHG emissions intensity per metric ton of product was 0.77 for Pulp, 1.19 for Fine Paper, 0.87 for Household Paper (Taiwan sites), 0.81 for Containerboard and 0.10 for Corrugated Packaging. Intensity varies across product lines because of differences in process characteristics and energy requirements. YFY continues to reduce emissions per unit of product through equipment improvement, process optimization and energy-mix transformation, with the higher-intensity pulp and paper production lines as the priority for further reduction.
Product-based and revenue-based emissions intensity should be read together, as they respond to different drivers. On the consolidated financial reporting boundary, absolute Scope 1 and Scope 2 emissions fell 3.1% in 2025, while consolidated revenue declined 6% to NT$73.643 billion – mainly reflecting international pulp prices consolidating at relatively low levels and changes in U.S. tariff policy affecting export momentum for certain products. Because revenue fell faster than emissions, GHG emissions intensity per unit of revenue rose from 31.7 to 32.7 metric tons CO₂e per NT$ million of revenue. As revenue-based intensity is sensitive to product prices and product mix, YFY manages both measures: physical intensity per metric ton of product to track operational and energy performance, and revenue-based intensity to monitor the carbon intensity of earnings.
GHG Emissions Intensity of products
Unit: Metric tons CO2e / Metric tons of products
Product
2025
Pulp
0.77
Fine Paper
1.19
Household Paper
0.87
Containerboard
0.81
Corrugated Packaging
0.10
* The data scope includes Scope 1 and Scope 2 emissions from all production sites of the Forest, Pulp & Paper Group (excluding Kuanyin) and the Containerboard and Packaging Group covered in this report, as well as the Taiwan production sites of the Consumer Products Group.
Strengthening Value Chain Carbon Management and Expanding Scope 3 Inventory Coverage
Since 2024, YFY has progressively established a Group-wide Scope 3 GHG inventory mechanism, extending carbon management from Scope 1 and Scope 2 to the upstream and downstream value chain. In 2025, YFY further expanded its domestic inventory boundary by including additional paper mills of selected Taiwan subsidiaries, improving the completeness of value-chain emissions data. Scope 3 emissions totaled approximately 1.224 million metric tons CO₂e in 2025, inventoried across all 15 categories of the GHG Protocol Corporate Value Chain (Scope 3) Accounting and Reporting Standard. Category 1 (purchased goods and services) accounted for approximately 905,000 metric tons, or about 74%; Category 3 (fuel- and energy-related activities not included in Scope 1 or Scope 2) for approximately 194,000 metric tons, or about 16%; and Category 4 (upstream transportation and distribution) for approximately 80,000 metric tons, or about 6.5%. The remaining approximately 45,000 metric tons, or about 3.7%, were distributed across the other categories, of which end-of-life treatment of sold products and downstream transportation and distribution were the largest. YFY will continue to expand inventory coverage and advance supply-chain decarbonization targeting major emissions hotspots in raw materials, energy, and logistics.
Material Subsidiaries Included in the Consolidated Financial StatementsNotes 3, 4
2025
Category 1: Purchased Goods and Services
904,924
Category 2: Capital Goods
8,250
Category 3: Fuel- and Energy-Related Activities (Not Included in Scope 1 or Scope 2)
194,427
Category 4: Upstream Transportation and Distribution
79,753
Category 5: Waste Generated in Operations
5,586
Category 6: Business Travel
123
Category 7: Employee Commuting
700
Category 8: Upstream Leased Assets
1,394
Category 9: Downstream Transportation and Distribution
10,909
Category 10: Processing of Sold Products
-
Category 11: Use of Sold Products
-
Category 12: End-of-Life Treatment of Sold Products
16,851
Category 13: Downstream Leased Assets
920
Category 14: Franchises
-
Category 15: Investments
611
Subtotal
1,224,448
Total
1,224,457
Note 1: Data scope: YFY Inc. (Head Office).
Note 2: YFY Inc. (Head Office) discloses indirect emissions in accordance with ISO 14064-1:2018 and its materiality criteria, with assurance provided by BSI in accordance with ISO 14064-3. ISO 14064-1 Category 4.1 corresponds to GHG Protocol Scope 3 Category 3. The Head Office figure is presented separately in this table and is not included in the subsidiary subtotal.
Note 4: Scope 3 emissions are disclosed by category in accordance with the GHG Protocol Corporate Value Chain (Scope 3) Accounting and Reporting Standard. A dash indicates that the category is not applicable to YFY’s operations or that emissions are zero.
Internal Carbon Pricing
YFY is progressively incorporating carbon costs into corporate investment and capital-allocation decisions. Internal carbon pricing is calculated based on the estimated costs required for each plant’s decarbonization measures, including initial investment, subsequent operation and maintenance expenses, and the expected cumulative Scope 1 and Scope 2 emissions reductions, to derive the abatement cost per metric ton of GHG emissions reduced. The Company applies a Shadow Price mechanism, incorporating a carbon price into investment assessments and capital-expenditure decisions. The mechanism is prioritized for listed subsidiaries that are significant emissions sources and serves as an evaluation metric for new investment projects and related capital expenditures.
By translating carbon-reduction benefits into financial value and combining them with payback period (PBP) and investment-benefit assessments, YFY can compare the effectiveness of different energy-efficiency, process-improvement, renewable-energy, and low-carbon technology projects, guiding capital allocation toward low-carbon transition. Based on the consolidated financial reporting boundary, combined Scope 1 and Scope 2 emissions were approximately 2.487 million metric tons CO₂e in 2024 and decreased to approximately 2.409 million metric tons CO₂e in 2025, a 3.1% reduction from the baseline year, meeting the phased milestone of a 1% reduction from the baseline year. The Company uses 2024 as the emissions-reduction baseline year for this reporting boundary and has set targets to achieve a 2% reduction by 2026, a 22% reduction by 2035, a 50% reduction by 2040, and net-zero emissions by 2050.
Strategy and Targets
Energy management is a key foundation of YFY's low-carbon transition and an important means of strengthening operational resilience and cost competitiveness. In response to energy price volatility, rising carbon costs, and coal phase-out policies adopted by local governments in Taiwan, YFY continues to prioritize coal substitution to reduce reliance on fossil fuels. The Group advances alternative fuels, biomass energy, low-carbon fuel switching, renewable energy, energy storage, and smart energy management through four strategic directions: developing low-carbon energy based on the Saccharide Economy and enabled by technology; integrating the green industry chain and systematizing green power generation and sales; creating green power value and introducing smart energy systems; and integrating energy and carbon management systems.
YFY Energy Management Strategy
Developing Low-Carbon Energy Based on the Saccharide Economy and Powered by Technology
Integrating the Green Industry Chain and Systematizing Green Power Generation and Sales
Creating Green Power Value and Introducing Smart Energy Systems
Integrating Energy and Carbon Management Systems
Centered on bio-based product materials, build a Circular Economy across production supply chains and product development.
Prioritize biomass feedstocks as substitutes for coal.
Leverage paper-industry characteristics to develop liquid lignin-based power generation, gaseous biogas power generation, and coal-free cogeneration using solid resource-recycling fuels.
In February 2024, the Group obtained a renewable-energy retail electricity license and integrated smart-energy and carbon-management services to provide net-zero sustainability solutions.
Connect green-power generation, electricity retailing, green-energy applications, and carbon-reduction services across the green industry chain, balancing decarbonization with business growth to maximize the value of Group resources.
Integrate energy-use and green-generation forecasting, and develop energy-storage and smart-energy systems to establish smart, sustainable sites.
Optimize site-level energy and resource efficiency and connect to the main grid, using smart systems to support grid stability in Taiwan.
Secure Group site energy supply with low-carbon energy and innovative technologies, accelerate the Group’s net-zero transition, and expand into emerging energy markets.
Use platform systems to integrate Group smart-energy and carbon-management functions, creating new green and carbon-related business opportunities and business models.
Make site energy-efficiency and carbon-emissions monitoring part of daily management, and analyze the economic efficiency of site operations.
Build key internal expertise to commercialize relevant technologies and capture opportunities in emerging energy markets.
In 2025, eight YFY production sites across Taiwan, Mainland China, and Vietnam maintained ISO 50001 Energy Management System certification. Through institutionalized energy management, YFY continued to improve energy efficiency through process optimization, equipment replacement, and digital energy management, while strengthening energy self-sufficiency and power-supply resilience through on-site biomass power generation, solar power, and smart energy systems. By 2030, YFY targets an average annual electricity-saving rate of at least 1.5% at each site and a combined alternative-energy input share (biomass energy plus alternative fuels) of at least 35%. In 2025, the actual annual electricity-saving rate reached 2.3%, while the combined alternative-energy input share reached 36%, both outperforming the annual targets and supporting the gradual decoupling of production growth from energy use and carbon emissions.
Energy Mix and Consumption
In 2025, total energy input across the three business groups was approximately 33.93 million GJ, down 2.7% year on year. Renewable energy input increased by 1.8%, while non-renewable energy input decreased by 4.3%. After deducting energy sold, total energy consumption was approximately 33.72 million GJ, down 2.9% from the previous year. Coal use decreased by approximately 1.52 million GJ, while heavy oil/fuel oil use decreased by approximately 59,000 GJ, reflecting progress in fuel transition and energy-efficiency improvements.
In terms of the energy mix, fossil fuels accounted for 55.4% of total energy input across the three business groups in Taiwan, Mainland China, and Vietnam in 2025, followed by biomass energy at 26.7%, alternative fuels at 9.5%, and purchased energy at 8.2%. The combined share of biomass energy and alternative fuels reached 36%. Among individual business groups, the highest biomass-energy share was 46.3%.
Energy Input by the Three Business Groups (Taiwan, Mainland China, and Vietnam)
Energy Type
Forest, Pulp & Paper Group
Containerboard and Packaging Group – Mainland China
Containerboard and Packaging Group – Taiwan & Vietnam
Consumer Products Group
Three Business Groups
Purchased Energy (Purchased Steam and Electricity)
8.0%
5.3%
8.2%
57.7%
8.2%
Fossil Fuels (Coal, Fuel Oil, Diesel, LPG, and Natural Gas)
43.1%
88.5%
48.2%
36.7%
55.4%
Alternative Fuels (Resource-Recycling Fuels, Recovered Paper Residues, Waste Plastic Film, and Sludge)
2.3%
1.2%
35.1%
0.9%
9.5%
Biomass Energy (Biogas, Lignin Black Liquor, Bark, Waste Wood / Wood Chips / Sawdust)
46.3%
5.0%
8.5%
4.6%
26.7%
Total Energy Input
100.0%
100.0%
100.0%
100.0%
100.0%
* Data scope: All production sites listed in the YFY Operating Sites List.
* Fuel and electricity heating values are based on the “Unit Heating Values of Energy Products” published by the Energy Administration, Ministry of Economic Affairs, together with in-house heating-value test results. For details, please refer to the appendix, “Energy Conversion Heating Value Table.”
* Total energy input includes solar energy; as its share is below 0.5%, it is not presented separately in the table above.
Historical Energy Consumption
Energy Input (Taiwan, Mainland China, and Vietnam)
Unit: GJ
Energy Type
2022
2023
2024
2025
Purchased Energy
3,218,753
2,814,724
2,790,388
2,788,550
Purchased Electricity
2,895,819
2,485,140
2,424,434
2,389,773
Purchased Steam
322,934
329,584
365,954
398,777
Fossil Fuels
20,859,659
20,906,543
20,026,726
18,805,766
Alternative Fuels
3,351,559
3,958,090
3,068,675
3,209,492
Biomass Energy
9,016,156
8,537,915
8,961,643
9,073,562
Solar Energy
5,281
15,239
15,554
47,801
Total Energy Input
36,451,408
36,232,511
34,862,986
33,925,171
Energy Sold (Taiwan, Mainland China, and Vietnam)
Unit: GJ
Item
2022
2023
2024
2025
Energy Sold
217,531
230,565
145,567
206,971
Energy Consumption = Energy Input − Energy Sold (Taiwan, Mainland China, and Vietnam)
Unit: GJ
Item
2022
2023
2024
2025
Energy Consumption
36,233,877
36,001,946
34,717,419
33,718,200
Renewable and Non-Renewable Energy Input (Taiwan, Mainland China, and Vietnam)
Energy Type
2022
2023
2024
2025
Non-Renewable Energy Input (MWh)
7,617,221
7,686,521
7,188,333
6,882,283
Non-Renewable Energy Input (GJ)
27,421,975
27,671,452
25,877,977
24,776,199
Renewable Energy Input (MWh)
2,506,711
2,374,543
2,495,838
2,541,383
Renewable Energy Input (GJ)
9,024,152
8,548,349
8,985,009
9,148,972
Data Coverage
100%
100%
100%
100%
* Data scope: All production sites within the “Entities Included in the Report.”
* 1 GJ = 0.277778 MWh.
Focusing on Taiwan, total energy input in 2025 was approximately 20.75 million GJ. Fossil fuels accounted for 47.5%, biomass energy for 28.4%, alternative fuels for 15.0%, and purchased energy for 8.9%. Biomass energy and alternative fuels together accounted for 43.4%, higher than the 36% share across the three business groups as a whole, reflecting continued efforts at Taiwan sites to reduce reliance on fossil fuels through biomass energy and resource-recycling fuels. Biomass energy accounted for 41.8% of energy input in the Forest, Pulp & Paper Group, while alternative fuels accounted for 37.3% in the Containerboard and Packaging Group. Renewable electricity was generated primarily from on-site biomass power, with more than 210 million kWh generated and consumed on site in 2025. Renewable electricity has accounted for approximately 11% of electricity use over the past two years.
Energy Input by the Three Business Groups (Taiwan)
Energy Type
Forest, Pulp & Paper Group
Containerboard and Packaging Group
Consumer Products Group
Three Business Groups
Purchased Energy (Purchased Steam and Electricity)
10.1%
3.1%
31.2%
8.9%
Fossil Fuels (Coal, Fuel Oil, Diesel, LPG, and Natural Gas)
44.5%
50.5%
59.7%
47.5%
Alternative Fuels (Resource-Recycling Fuels, Recovered Paper Residues, Waste Plastic Film, and Sludge)
3.2%
37.3%
1.4%
15.0%
Biomass Energy (Biogas, Lignin Black Liquor, Bark, Waste Wood / Wood Chips / Sawdust)
41.8%
9.0%
7.4%
28.4%
Total Energy Input
100.0%
100.0%
100.0%
100.0%
* Data scope: Taiwan production sites listed in the YFY Operating Sites List.
* Fuel and electricity heating values are based on the “Unit Heating Values of Energy Products” published by the Energy Administration, Ministry of Economic Affairs, together with in-house heating-value test results. For details, please refer to the appendix, “Energy Conversion Heating Value Table.”
* Total energy input includes solar energy; as its share is below 0.5%, it is not presented separately in the table above.
In terms of energy self-sufficiency, electricity generated and consumed on site accounted for 67% of total electricity use across YFY sites in Taiwan, Mainland China, and Vietnam in 2025. The ratio was approximately 60% at Taiwan sites, while the electricity self-sufficiency rate exceeded 80% at certain sites. YFY also continued to expand renewable energy. In 2025, more than 210 million kWh of biomass-generated electricity and approximately 13.3 million kWh of solar power were generated and consumed on site. YFY has applied for and obtained nearly 140,000 renewable energy certificates.
Energy-Saving and Carbon-Reduction Performance
In 2025, YFY's Taiwan production sites completed nearly 40 energy-saving and carbon-reduction initiatives, delivering total energy savings of more than 0.66 million GJ and carbon reductions of more than 87,000 metric tons CO2e. Fuel switching contributed the largest share of energy savings at 48.8%, while equipment improvement or replacement accounted for the largest share of carbon reductions at 64.7%, demonstrating tangible results from replacing energy-intensive equipment, improving process efficiency, and switching to lower-carbon fuels.
Energy Consumption 20,634,269 GJ
59.8%
34.5%
5.7%
Consumer Products Group
Containerboard and Packaging Group
Forest, Pulp & Paper Group
Total Energy Savings Over 0.66 million GJ
48.8%
35.6%
15.0%
Process Redesign
0.6% Operational Adjustments
Equipment Improvement or Replacement
Fuel Switching
Total Carbon Reduction Over 87,000 tCO2e
27.5%
64.7%
7.2%
Process Redesign
0.6% Operational Adjustments
Equipment Improvement or Replacement
Fuel Switching
* Data scope: Taiwan production sites listed under “Entities Included in the Report.”
* Energy Consumption = Energy Input − Energy Sold.
* Energy-saving measures include fuel (coal), electricity, and steam; energy savings are calculated using the previous year as the base year.
* Carbon reductions primarily cover Scope 1 (direct) and Scope 2 (energy indirect) emissions; reductions are calculated using the previous year as the base year.
Energy Intensity within the Organization
YFY continues to reduce energy demand in product manufacturing through equipment improvement, process optimization, and energy-mix transformation, while tracking energy-use efficiency through energy intensity per unit of product. In 2025, energy intensity was 19.19 GJ per metric ton of product for Pulp and Fine Paper, 10.59 for Household Paper, 9.80 for Containerboard, and 0.94 for Corrugated Packaging. YFY continues to support the low-carbon transition of its products through ongoing improvements in energy efficiency.
Energy Intensity within the Organization
Product
Unit
2022
2023
2024
2025
Pulp and Fine Paper Products
gigajoule per metric tons of total product
25.7
20
20.94
19.19
Household Paper
gigajoule per metric tons of total product
13.11
12.60
12.74
10.59
Containerboard
gigajoule per metric tons of total product
10.74
10.96
9.74
9.80
Corrugated Packaging
gigajoule per thousand square meters of total product
1.01
1.22
0.93
0.94
* Data Scope: All production sites of the Forest, Pulp & Paper Group and the Containerboard and Packaging Group, and the Taiwan production sites of the Consumer Products Group listed in the “Entities Included in the Report.”
Strategy and Targets
Water is an essential medium in papermaking, carrying fibers and energy while helping maintain product quality. In response to water scarcity risks arising from climate change, rising water costs, and increasingly stringent effluent management requirements, YFY is guided by the principle of "maximizing the value of water resources." The Group continues to improve water circulation and reuse efficiency to mitigate risks including production interruptions caused by water shortages, higher costs resulting from inefficient water use, and environmental impacts associated with inadequate discharge management. YFY advances water stewardship through five strategic pillars: establishing management systems; process water recycling and reuse; optimizing water treatment and improving water quality; establishing a public and transparent water footprint; and recharging wetlands and fostering ecosystems. By 2030, YFY aims to achieve a water recycling rate of 90% at paper mills and reduce annual water consumption by 1% compared with the previous year.
YFY Water Management Strategy
Establish Management Systems
Process Water Recycling and Reuse
Optimize Water Treatment and Improve Water Quality
Implement and maintain ISO 14001 Environmental Management Systems.
Recycle and reuse white water, install disinfection equipment for reclaimed water, and increase biological-basin concentration at wastewater treatment plants to improve process-water recovery.
Improve wastewater quality at the source while increasing the stability of water-treatment operations.
Establish a Public and Transparent Water Footprint
Recharge Wetlands and Foster Ecosystems
Assess water stress at each plant to reduce water-shortage risk.
Establish early-warning systems from process management through discharge-water monitoring, and disclose real-time information externally.
Use treated plant discharge water in wetland purification and recharge to restore wetland ecosystems and create biodiversity.
Water Resource Use and Circular Management
YFY manages water across the full cycle, from withdrawal and process use to recovery, reuse and discharge. Through white-water recovery, process-water reuse, equipment upgrades and real-time water-quality monitoring, the Group reduces freshwater demand and improves water-use efficiency. In 2025, the average water recycling rate at paper mills exceeded 90%, while the rate at the Containerboard and Packaging Group’s paper mills in Taiwan and Vietnam reached 95.35%. Production sites also use online water-quality and flow monitoring, supplemented by manual sampling and laboratory testing, to monitor process wastewater and final effluent around the clock.
In 2025, total water withdrawal across the three business groups in Taiwan was approximately 32,156 million liters, total water discharge was approximately 31,645 million liters, and total water consumption was 511 million liters. Water consumption was approximately 543 million liters for the Containerboard and Packaging Group and 195 million liters for the Consumer Products Group. At certain Forest, Pulp & Paper Group sites, effluent from neighboring farmland flows into the sites and is discharged together through the sites’ outfalls. As a result, reported discharge volumes may exceed process water withdrawal, causing a negative value when water consumption is calculated as the difference between withdrawal and discharge; this does not represent actual negative water consumption. YFY continues to improve water-use efficiency at its Taiwan sites through water-balance management, process-water recycling and monitoring mechanisms.
Water Resource Use (Taiwan)
Unit: million liters
23,805
24,032
-227
Forest, Pulp & Paper Group
6,809
6,266
543
Containerboard and Packaging Group
1,543
1,347
195
Consumer Products Group
32,156
31,645
511
Three Business Groups
Total Water Withdrawal (a)
Total Water Discharge (b)
Total Water Consumption (a−b)
* Data scope: Taiwan production sites listed under “Entities Included in the Report.”
* Effluent discharge standards at Taiwan sites are based on the Effluent Standards promulgated by the Ministry of Environment and the sewer acceptance standards set by individual industrial parks.
* At certain Forest, Pulp & Paper Group sites, effluent from neighboring farmland flows into the site and is discharged through the site outfall. Under applicable regulations, effluent flow meters are installed at the end of the discharge channel or at the outlet, which may result in discharge volumes exceeding process water withdrawal.
With respect to water circularity, YFY actively assesses the water-quality requirements of each papermaking process and recovers discharge water from different processes for reuse, substituting recycled water for freshwater and supplying it to other processes. White water recovered from overflow tanks can be reused for dilution, washing, cooling and odor-control water seals. Recovered process water and low-pressure steam are also used as part of odor-control measures. In addition, installing disinfection equipment for reclaimed water and increasing biological-basin concentration at wastewater treatment plants have further improved water reuse. The Yangzhou Plant of the Containerboard and Packaging Group continues to operate a rainwater harvesting system that converts rainwater into a reusable water resource. In 2025, approximately 134 million liters of rainwater were reused, reducing reliance on external water sources.
Historical Water Resource Data
Historical Water Withdrawal, Discharge, and Consumption (Taiwan, Mainland China, and Vietnam)
Unit: million liters
Item
2022
2023
2024
2025
1.1 Water Withdrawal – Surface Water (excluding rainwater)
13,203
13,324
13,826
14,449
1.2 Water Withdrawal – Rainwater
112
133
190
134
1.3 Water Withdrawal – Groundwater
30,875
30,587
30,918
32,007
1.4 Water Withdrawal – Municipal Water
632
602
618
621
1.5 Water Withdrawal – Externally Supplied Reclaimed Water
30
32
38
45
1.6 Total Water Withdrawal (1.1+1.2+1.3+1.4+1.5)
44,852
44,678
45,590
47,256
2.1 Water Discharge – Discharge to Surface Water
39,607
40,631
42,569
42,024
2.2 Water Discharge – Discharge to Industrial Park Wastewater Treatment Systems
741
782
909
944
2.3 Water Discharge – Third-Party Water Supplied for Use by Other Organizations
0
9
0
0
2.4 Total Water Discharge (2.1+2.2+2.3)
40,348
41,422
43,478
42,968
Water Consumption = 1.6 Total Water Withdrawal − 2.4 Total Water Discharge
4,504
3,256
2,112
4,288
3.1 Total Water Storage at Year-End
18
19
16
16
3.2 Total Water Storage at Beginning of Year
14
18
19
16
* Data scope: All production sites listed under “Entities Included in the Report.”
* Water discharge at sites in Mainland China and Vietnam is managed in accordance with applicable local regulations, discharge permits, environmental impact assessment requirements, and sewer-connection requirements, together with each site's wastewater treatment system operating standards. Sites in Mainland China are managed primarily in accordance with discharge permits and local water-pollutant discharge standards, with certain sites adopting internal control limits more stringent than regulatory thresholds to reduce the risk of non-compliance. Sites in Vietnam are managed in accordance with local discharge standards, wastewater treatment system operating procedures, and treatment-facility design capacity to ensure that effluent meets applicable discharge requirements prior to release.
Water Withdrawal, Discharge, and Consumption in High and Extremely High Water-Stress Areas (Taiwan, Mainland China, and Vietnam)
Unit: million liters, unless otherwise stated
Item
2022
2023
2024
2025
4.1 Water Withdrawal – Surface Water (excluding rainwater)
0
0
0
0
4.2 Water Withdrawal – Rainwater
0
0
0
0
4.3 Water Withdrawal – Groundwater
0
0
0
0
4.4 Water Withdrawal – Municipal Water
154
116
128
115
4.5 Water Withdrawal – Externally Supplied Reclaimed Water
0
0
0
0
4.6 Total Water Withdrawal (4.1+4.2+4.3+4.4+4.5)
154
116
128
115
5.1 Water Discharge – Discharge to Surface Water
0
0
0
0
5.2 Water Discharge – Discharge to Industrial Park Wastewater Treatment Systems
81
70
73
84
5.3 Water Discharge – Third-Party Water Supplied for Use by Other Organizations
0
0
0
0
5.4 Total Water Discharge (5.1+5.2+5.3)
81
70
73
84
Water Consumption = 4.6 Total Water Withdrawal − 5.4 Total Water Discharge
73
46
55
31
Water Consumption (Unit: million cubic meters)
0.073
0.046
0.055
0.031
Data Coverage – High and Extremely High Water-Stress Areas
100%
100%
100%
100%
* Data scope: All production sites listed under “Entities Included in the Report.”
Water Quality Management and Ecological Coexistence
YFY’s production sites manage effluent in accordance with applicable local regulations, discharge permits and industrial-park sewer acceptance requirements, while setting internal control standards based on actual operating conditions. Process wastewater is treated through chemical coagulation and sedimentation, biological treatment and other processes. YFY also improves treatment efficiency through white-water recovery, chemical-use management and equipment upgrades. Effluent is discharged only after confirming compliance with applicable water-quality requirements. A portion of treated effluent is further supplied to constructed wetlands, integrating water circularity with biodiversity conservation.
YFY continues to disclose water-quality information. Production sites conduct water-quality testing and regulatory reporting in accordance with applicable requirements, supported by real-time monitoring and early-warning mechanisms. Effluent from Chung Hwa Pulp Corporation’s Jiutang Plant also provides approximately 90% of the water supply to Kaohsiung’s Old Railroad Bridge Wetland, supporting wetland ecosystems and biodiversity with treated water.
Historical Wastewater Discharge Indicators
Chemical Oxygen Demand (COD) (Taiwan, Mainland China, and Vietnam)
Unit: metric tons
Item
2022
2023
2024
2025
Direct Chemical Oxygen Demand (COD)
3,438
3,485
3,484
3,575
Data Coverage
100%
100%
100%
100%
* Data scope: All production sites listed under “Entities Included in the Report.”
Adsorbable Organic Halides (AOX) (Taiwan, Mainland China, and Vietnam)
Unit: kilograms
Item
2022
2023
2024
2025
Adsorbable Organic Halides (AOX)
1.29×10⁻⁶
4.95×10⁻⁶
1.67×10⁻⁵
3.89×10⁻⁵
Data Coverage
100%
100%
100%
100%
* Data scope: All production sites listed under “Entities Included in the Report.”
* Discharge data are based on sites with actual monitoring data.
Water Resource Risk Analysis
YFY follows its TCFD management mechanism and uses the World Resources Institute (WRI) Aqueduct tool to assess water stress at each production site. Under the SSP1 RCP2.6 scenario, seven production sites are projected to be located in areas of extremely high water stress (>80%) by 2030. All of these sites are corrugated-container plants, which have lower water demand than paper mills and are primarily located in well-planned industrial zones. Process wastewater is treated on site and then undergoes secondary treatment through industrial-park wastewater treatment systems, reducing water-related and environmental risks.
In 2025, total water withdrawal at sites in water-stressed areas was 115 million liters, while total water consumption was 31 million liters, representing a 44% year-on-year decrease in water consumption. Water withdrawal and consumption at these sites accounted for only 0.24% and 0.73%, respectively, of YFY’s overall totals, indicating a relatively low overall exposure.
Water-Stress Risk Distribution of Production Sites
* Data scope: All production sites listed under “Entities Included in the Report.”
Resource Circularity Management
YFY originated from the use of agricultural and forestry residues in building materials and papermaking, and has long followed a zero-waste philosophy. From recycled-fiber papermaking and water circularity to process-residue recovery, biomass energy and low-carbon material development, YFY continues to advance resource circularity, which is critical to reducing dependence on raw materials, lowering waste-treatment costs, improving resource efficiency and developing new business opportunities. In response to global resource constraints and the transition toward a circular and net-zero economy, YFY applies a value-chain approach to manage resource inputs, process use and final destinations. Through source reduction, reuse, recycling, alternative fuels, product redesign and new technology R&D, process residues, by-products and waste are returned to material or energy cycles, reducing demand for virgin resources and fossil fuels.
YFY has established "advancing the Circular Economy and zero waste while reducing total waste generation" as its long-term direction, continuously increasing resource recovery while reducing waste directed to final disposal. The Group targets a waste-to-resource ratio of 95% by 2030 and a 1% annual reduction in direct waste disposal versus the prior year. In 2025, the waste-to-resource ratio reached 94%, exceeding the interim target of at least 87%; waste directed to disposal decreased by 14% year on year, outperforming the annual management target of a 1% reduction.
YFY Waste Management Strategy
Establish Management Systems
Production Residue Reclamation and Recycling
Develop Circular Economy Business Models
Implement ISO 14001 Environmental Management Systems.
Fiber residuals are directly remade into paper products.
Other recycling routes produce cement products/raw materials, insulation materials, fertilizers and other products.
High-calorific organic residues are processed into solid recovered fuel to replace coal and heavy oil.
Use YFY’s Net Zero Circularity system to develop new business models.
Waste Generation and Resource Recovery Performance
In 2025, total waste generated across all YFY production sites was 569,588 metric tons, representing a decrease of nearly 2% from 2024. Approximately 534,879 metric tons were recovered through recycling, including conversion into paper or other products, production of alternative fuels, and reuse after solidification or physical treatment as cement raw materials, cement products, insulation materials or fertilizers. The overall waste-to-resource ratio reached 94%. Waste that could not be further recovered was managed through incineration, landfilling or other lawful treatment methods according to its characteristics. In 2025, waste directed to disposal totaled 34,709 metric tons, down 14% from the previous year, further reducing the need for final disposal.
Beginning in 2025, YFY revised its waste treatment classifications and terminology in alignment with GRI 306. Under the revised approach, "Recycling" incorporates the previous year's categories of reuse, recycling and production of alternative fuels. This page uses the classifications "Preparation for reuse," "Recycling" and "Total waste disposed"; data are therefore not directly comparable with prior-year classifications.
Waste Generation
579,743 metric tons
569,588 metric tons
32%
36%
31%
31%
36%
32%
1% Other Non-Hazardous Waste
0.1% Hazardous Industrial Waste
Non-Hazardous Rejects (Light Rejects / Trimmings + Heavy Rejects)
* Data scope: all production sites listed in “Entities Included in the Report.”
* Waste data are compiled by each plant based on actual process output, waste category, flow and treatment method and consolidated by the parent company. Source records include on-site weighing, process-output records, wastewater-sludge records, boiler/cogeneration ash records, off-site transport manifests, weigh tickets, service-provider reports and regulatory declarations. About 55% of waste is handled by external vendors, mainly evidenced by transport manifests, weigh tickets, licensed-vendor treatment records or regulatory declarations; the remaining 45%, handled on site or within the Group, is mainly based on internal operating or weighing records.
Historical Waste Composition
Unit: metric tons
Waste Category
2022
2023
2024
2025
Non-Hazardous Rejects (Light Rejects / Trimmings + Heavy Rejects)
* Data scope: All production sites listed under “Entities Included in the Report.”
Waste Management Strategies and Measures
YFY extends waste management beyond end-of-pipe disposal to production processes and the product life cycle, reducing resource losses at the source and increasing recovery value through circular technologies and waste-flow management.
Source Reduction and Production Planning: Optimize production scheduling, improve raw-material use efficiency and control process losses to reduce waste generated from production inefficiencies and process losses.
Strengthen Material Recovery and Recycling Technologies: Continue recovering agricultural and forestry by-products, fibers, recovered paper, water-based printing pigments and iron wire. For example, the Yangzhou Plant extracts straw fiber from rice and wheat straw to make nPulp bio-pulp, which is then processed into various green packaging materials, increasing the value of agricultural by-products.
Invest in Waste-Reduction and Low-Carbon Fuel R&D: Establish dedicated waste-application teams to integrate on-site process residues with external reusable feedstocks and develop wood pellets and resource-recycling fuels to substitute for coal and reduce waste-disposal demand.
Product Redesign: Improve recyclability through product design. For example, Chung Hwa Pulp Corporation's CircuWell all-paper recyclable, plastic-free series can enter conventional paper recycling systems directly, increasing fiber circularity.
Strengthen Environmental Management to Reduce Impacts: Follow ISO 14001 management mechanisms by recording waste movements, conducting monthly inventories, annual risk identification, and internal and external audits, and carrying out hazard identification and improvement measures for regulated waste.
Track Waste Flows and Ensure Proper Treatment: Track off-site transport and final treatment through government waste-management systems, GPS routing, transport manifests and treatment records. Vehicle follow-up or final-destination verification is conducted when necessary to ensure that waste clearance and treatment comply with applicable regulatory and contractual requirements.
Waste-to-Energy: Building Liquid, Gaseous and Solid Energy Circularity
Papermaking is inherently resource-circular. YFY further converts process residues, by-products and organic resources into energy and develops liquid, gaseous and solid forms of green energy, transforming materials that once required disposal into energy assets and creating a circular model of "Process Residues → Resource Recovery → Self-Generated Energy."
Liquid | Lignin Power Generation In the Forest, Pulp & Paper Group, lignin (black liquor) recovered from the pulping process is used as biomass energy for cogeneration and process steam, replacing heavy oil. The Hualien Plant operates Taiwan's only and largest lignin-based biomass power system and is currently advancing a large-scale retrofit, with plans to increase lignin concentration from 65% to 85% and generation capacity from 18,000 kW to 43,500 kW. Annual green electricity output is expected to double from 150 million kWh, moving toward full power self-sufficiency, with estimated annual emissions reductions of approximately 105,000 metric tons CO2e.
Gaseous | Biogas Power Generation YFY uses anaerobic treatment technology with proprietary bacteria to convert organic matter in papermaking process water into methane. The Xinwu Plant operates Taiwan's largest biogas power system, with an installed capacity of 5,200 kW, reducing the organic load of process wastewater while converting organic resources into usable energy. The system can also digest external food sludge, septic waste and food waste.
Solid | Resource-Recycling Fuels YFY processes recovered paper residues, recovered wood materials and high-calorific-value process residues through shredding, magnetic separation, air separation and conditioning to produce resource-recycling fuels. These fuels are used in cogeneration systems to replace a portion of coal consumption, supporting both waste diversion and lower-carbon energy use. In 2019, YFY built Taiwan's first cogeneration system operating entirely on resource-recycling fuels without coal.
In 2025, across the three business groups, alternative fuels accounted for 9.5% of energy input and biomass energy for 26.7%, representing approximately 36% combined. This demonstrates how resource circularity has expanded beyond conventional waste management to become an important contributor to the energy transition, while reducing waste-treatment costs, dependence on fossil fuels and associated environmental impacts.
Waste Flow and External Treatment Management
In 2025, YFY’s waste treatment flows comprised 38% treated on site, 7% treated at other Group plants and 55% managed by external vendors. External treatment includes recycling, alternative-fuel production, incineration, landfill, physical or chemical treatment and other approved methods. Because more than half of waste relies on external treatment, vendor qualifications, transport records, final destinations and reuse quality are important potential impacts. Through qualified-vendor management, retention of transport and treatment records, reconciliation of declaration data, follow-up on abnormalities and, where necessary, audits of final destinations, YFY maintains traceability from waste generation through final treatment.
Overall waste flows maintain 100% traceability, supported by a waste-management network comprising on-site treatment, other Group plants and qualified external treatment organizations. This approach reduces the environmental and compliance risks associated with illegal dumping, pollution, air emissions, improper residue management, unstable recycling quality and regulatory or reputational exposure.
Waste Treatment Methods
Waste Diverted from Disposal and Directed to Disposal
Unit: metric tons
Treatment Method
2022
2023
2024
2025
Total waste recycled/reused
493,051
525,371
539,380
534,879
– Preparation for reuse
0
0
0
0
– Recycling
493,051
525,371
539,380
534,879
Total waste disposed
44,466
37,837
40,362
34,709
– Waste landfilled
569
534
707
601
– Waste incinerated with energy recovery
0
0
0
0
– Waste incinerated without energy recovery
30,163
27,427
30,225
25,514
– Waste otherwise disposed
13,734
9,876
9,430
8,594
– Waste with unknown disposal method
0
0
0
0
Coverage (percentage of production sites)
100%
100%
100%
100%
* Data scope: all production sites listed in “Entities Included in the Report.”
* Beginning in 2025, YFY adjusted terminology for treatment categories after reviewing waste-disposal classifications. “Preparation for reuse” corresponds to prior-year “Waste reused”; “Recycling” combines the prior categories of “Waste reused,” “Waste recycled” and “Production of alternative fuels.” In accordance with GRI 306, incineration is also divided into with and without energy recovery; “Waste incinerated without energy recovery” corresponds to prior-year “Incineration.”
* Following the revised treatment categories, the waste-to-resource ratio formula has been updated accordingly: Waste-to-resource ratio = (Preparation for reuse + Recycling) / Total waste generated.
* Classification of waste diversion and direct disposal methods:
1. “Recycling” includes recovery into paper or other products, reuse after solidification or physical treatment (e.g., cement raw materials, cement products, insulation materials and fertilizers), and the production of alternative fuels.
2. “Waste otherwise disposed” is handed to third-party organizations for recycling or to licensed third-party waste-disposal organizations for consolidated treatment.
Hazardous Waste Management
In 2025, YFY generated 343 metric tons of hazardous waste, only approximately 0.06% of total waste generated. Although the share is low, the potential environmental, occupational-safety and compliance impacts are higher because hazardous waste may include ink sludge, waste oil, waste-oil drums, waste developer, waste fixer, monitoring waste liquids and flammable mixed waste; hazardous waste is therefore prioritized for control. It is mainly treated by external providers through incineration, landfill and other methods. Improper temporary storage, labeling, transport or treatment can cause soil or water pollution, leaks, fire risks, worker exposure and legal violations. YFY uses source reduction, segregated storage, clear labeling, qualified treatment organizations and complete transport, treatment and declaration records to ensure final destinations remain traceable.
Non-Greenhouse Gas Emissions Management
Managing non-greenhouse gas air emissions is fundamental to YFY's efforts to maintain air quality, protect employees and nearby communities, and comply with environmental regulations. Poor management of air pollutants can lead to neighborhood complaints, regulatory penalties, production restrictions, equipment shutdowns or reputational risk. Effective control improves working conditions, reduces compliance risk and responds to societal expectations for health and environmental quality.
YFY centers its approach on "regulatory compliance, source reduction and real-time monitoring." Each site strictly monitors and reports air-pollutant emissions under local requirements and continues investing in air-pollution control and monitoring equipment. Going forward, YFY will balance control-equipment investment costs against pollution-prevention benefits and continue reducing air-pollution risks to protect employees, local communities and the environment.
Management Strategy
YFY strengthens air-pollutant management through three strategies. Under Establish Management Systems, the Group implements ISO 14001 Environmental Management Systems to provide institutionalized environmental management and risk-control mechanisms. Under Comply with Government Regulations, aging equipment is replaced as required and additional pollution-control equipment is installed. Under Evaluate and Improve Technologies, YFY continuously evaluates access to cleaner fuels and maintains optimal boiler operating technologies to reduce pollutant generation at the source.
Air Pollutant Emissions Performance
At sites meeting local monitoring and reporting thresholds, emissions are periodically reported to local governments. Major air pollutants are nitrogen oxides (NOx), sulfur oxides (SOx), particulate matter (PM) and volatile organic compounds (VOCs).
In 2025, NOx emissions totaled 770 metric tons, SOx emissions 649 metric tons, PM emissions 208 metric tons and VOC emissions 167 metric tons. NOx and VOC emissions each decreased by more than 10% year on year, while SOx and PM were broadly unchanged. All emissions complied with local regulations; any non-compliance triggers immediate corrective action.
In addition to major air pollutants, YFY also monitors hazardous air pollutants (HAPs), including lead, cadmium, mercury, arsenic, hexavalent chromium and related compounds. In 2025, emissions of these pollutants were approximately 0.2 metric tons and remained extremely low. Historical data coverage has consistently been 100%.
Air Pollutant Emissions
Unit: metric tons
980
878
770
704
647
649
196
201
208
153
205
167
NOx
SOx
PM
VOCs
2023
2024
2025
* Data scope: all production sites listed in “Entities Included in the Report.”
* Historical data coverage has consistently been 100%.
* Other air pollutants include extremely low HAP emissions regulated under Taiwan’s Standards for Hazardous Air Pollutant Emission from Stationary Pollution Sources, such as lead, cadmium, mercury, arsenic, hexavalent chromium and related compounds: 0.1 metric tons in 2023, 0.2 in 2024 and 0.2 in 2025.
* Emission totals reflect sites and pollutants actually tested.
Air-Pollutant Management and Measures
YFY’s major production sites are equipped with dedicated air-pollution control equipment selected according to the characteristics of individual emission sources, and third-party inspections are scheduled regularly. Continuous online monitoring supports uninterrupted tracking of emissions, real-time operating adjustments and regular reporting. Pollution-control equipment is operated by professionally trained and certified personnel, with maintenance and operating records managed under standardized procedures to ensure reliable equipment performance.
Each site also maintains equipment inspection and preventive-maintenance plans. Critical equipment undergoes annual shutdown maintenance and comprehensive inspections, while designated personnel continuously monitor local air-quality conditions. When government authorities issue air-quality deterioration alerts, sites activate established response plans and, as appropriate, implement measures such as voluntary load reduction or equipment shutdowns in coordination with local authorities to help protect regional air quality.
Air-Pollution Incident Risk and Emergency Response
For higher-risk emission sources, YFY assesses potential pollutant dispersion and impact areas associated with major air-pollution incidents. Based on simulation results, surrounding sensitive receptors are identified, evacuation routes and assembly areas are planned, and relevant measures are incorporated into site emergency-response and notification procedures.
Sites maintain appropriate personal protective equipment, communication systems, firefighting equipment, warning devices, emergency-response equipment and decontamination supplies, and conduct regular emergency-response drills. Emergency-response plans define team responsibilities, notification procedures, personnel control requirements, use of protective equipment and spill-response methods. The locations of higher-risk equipment and emergency-access routes are also marked on site layout plans to support rapid response by both internal and external emergency personnel.
Historical Non-GHG Emissions
Unit:Metric Tons
Air Pollutant
Unit
2021
2022
2023
2024
2025
Nitrogen Oxides (NOx)
metric tons
1,249
927
980
878
770
Sulfur Oxides (SOx)
metric tons
1,221
922
704
647
649
Particulate Matter (PM)
metric tons
224
751
196
201
208
Volatile Organic Compounds (VOCs)
metric tons
140
316
153
205
167
Hazardous Air Pollutants (HAPs)
metric tons
0.08
0.1
0.1
0.2
0.18
Data Coverage
100%
100%
100%
100%
100%
* Scope of data: All production sites listed in the “Entities Covered by This Report.”
* Nitrogen oxides: Since the selected testing method measures total nitrogen oxides and cannot exclude N2O, NOx emissions are disclosed in accordance with applicable local regulations and GRI 305-7 reporting requirements.
* Sulfur oxides: Since the selected testing method measures total sulfur oxides and cannot separately quantify SO2, SOx emissions are disclosed in accordance with applicable local regulations and GRI 305-7 reporting requirements.
* Historical data coverage has consistently been 100%.
* Other air pollutants include hazardous air pollutants (HAPs), such as lead, cadmium, mercury, arsenic, hexavalent chromium, and related compounds regulated under the Ministry of Environment's “Emission Standards for Hazardous Air Pollutants from Stationary Sources.”
* Emission statistics are based on actual monitoring results from sites and pollutant categories for which monitoring data are available.