環境 Environment

Regenerative Value Chain

Source → Transformation → Regeneration

Regenerative Value Chain

Key Performance

2025 Quantitative Results

Performance Highlights

1. Responsible Sourcing

Responsible Wood Fiber Procurement

  • Wood fiber procured: 2.407 million tonnes
  • Certified or controlled sources: 41.4%

Strengthened wood-fiber supply chain traceability through FSC CoC, PEFC, FSC CW and other forest certification and controlled-source management systems.

Key Raw Material Certification

  • Imported pulp certified: 100%
  • Taiwan wood chips certified: 95.7%

Continued to expand raw-material certification coverage in response to EUDR and other international supply-chain due diligence and forest-risk management requirements.

Circular & Green Procurement

  • Recovered fiber: 1.649 million tonnes
  • Green procurement: NT$10.3 billion
  • Local suppliers: 93%

Advanced responsible procurement through both forest certification and recovered fiber, balancing circular resource use, local sourcing and raw-material resilience.

Supplier ESG Management

  • More than 2,000 suppliers signed the Code of Conduct
  • 1,018 suppliers assessed;
    0 rated Grade C

All new suppliers signed the Supplier Code of Conduct. No high-risk suppliers requiring immediate corrective action were identified, strengthening supply-chain resilience.

2. Low-Carbon Transition

Energy Self-Sufficiency & Low-Carbon Transition

  • Self-generated energy: 31.14 million GJ
  • Energy self-sufficiency: 92%
  • Biomass energy: 26.7%
  • Alternative fuels: 9.5%

Improved energy self-sufficiency and reduced dependence on external grids, strengthening resilience against energy-price volatility and supply risks.

Water Risk Management

  • Total water withdrawal: 47,256 million L
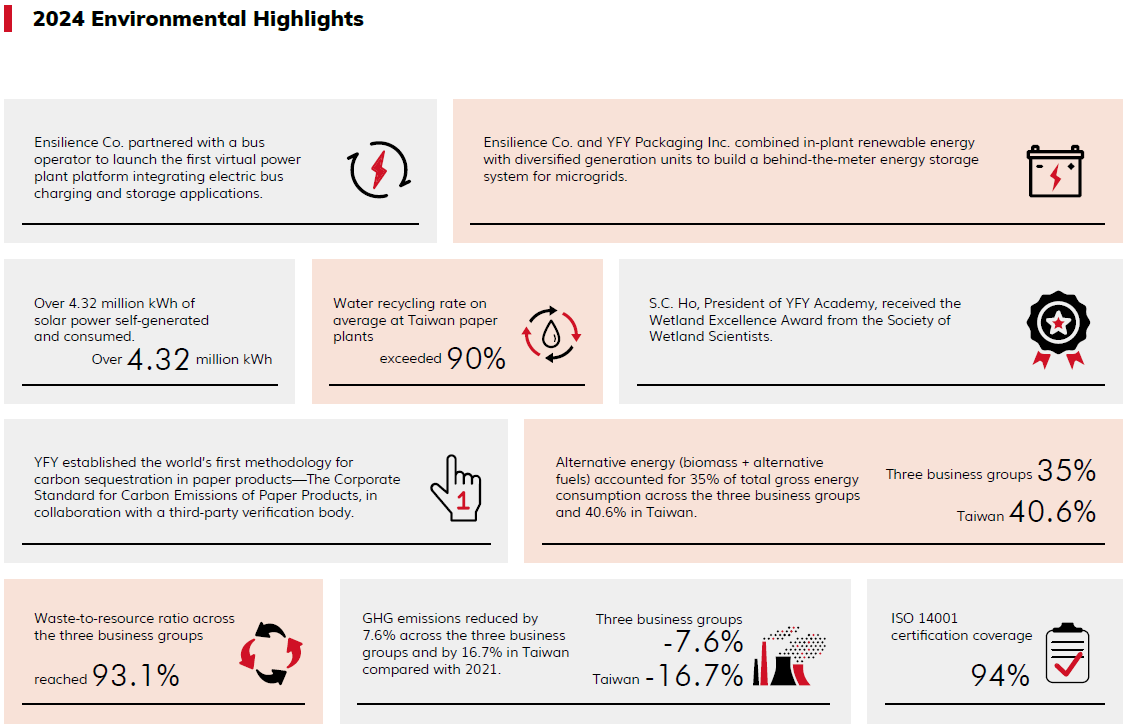
  • Water recycling rate at paper mills: >90%
  • Water withdrawal from high-stress areas: 0.24%

Reduced operational water risk and strengthened water resilience through high water-recycling rates and limited exposure to high water-stress areas.

Air Pollutant Management

  • NOx: 770 tonnes
  • SOx: 649 tonnes
  • PM: 208 tonnes

Continued investment in pollution-control equipment and process improvements to reduce major air-pollutant emissions and the environmental impacts of manufacturing.

3. Circular Regeneration

Waste Resource Recovery

  • Total waste: 569,000 tonnes
  • Recycled/recovered: approx. 535,000 tonnes
  • Resource recovery rate: 94%

The resource recovery rate has already exceeded the 2026 target of 87%, while waste reduction and circular use continue to advance.

Reduce Direct Disposal

  • Direct disposal decreased 14% YoY
  • Industrial paper resource recovery rate in Taiwan and Vietnam: 99.1%

Reduced final-disposal demand and improved resource efficiency through process improvements, resource recovery and cross-site circular utilization.

Waste Flow Management

  • Waste flow is 100% traceable

Established a complete waste-tracking mechanism through qualified contractor management, manifest reconciliation and flow verification, while converting process residues into alternative fuels and energy resources.


Circular Sustainability

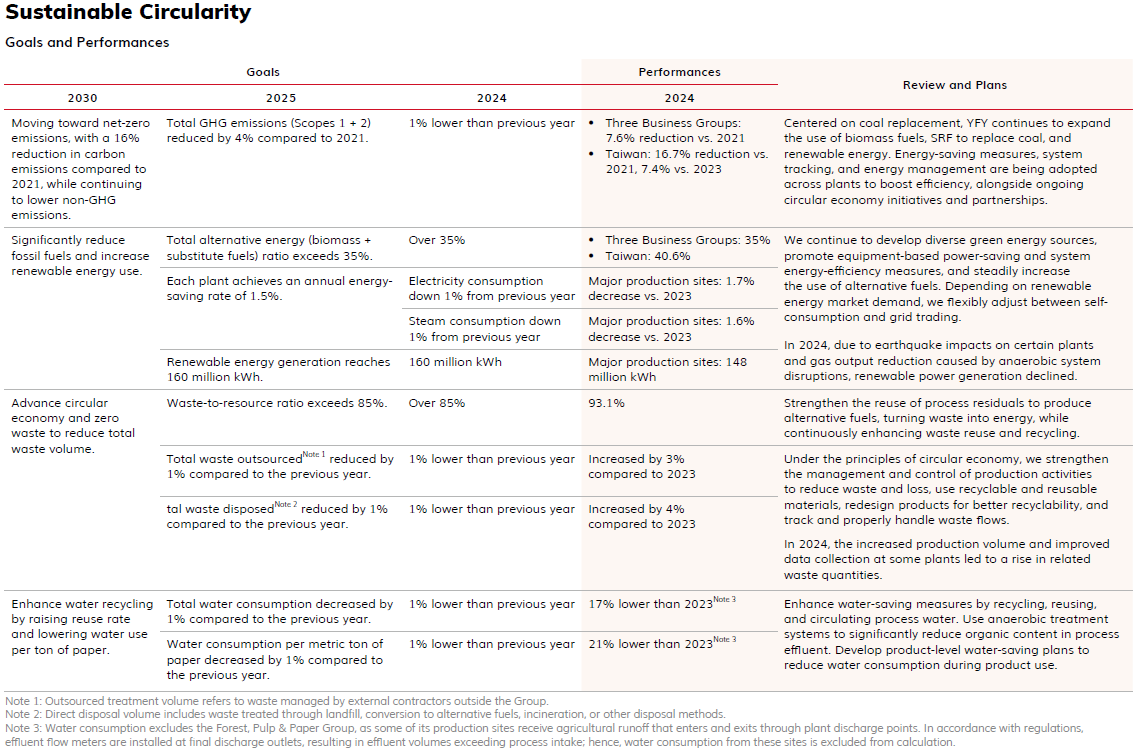
Targets and Implementation Results

Targets

Results

Review and Plans

2030

2026

2025

2025

Move toward net-zero emissions by reducing carbon emissions by 16% from the 2021 baseline while continuing to reduce non-GHG emissions.

Reduce total carbon emissions (Scopes 1+2) by 9% from the 2021 baselineNote 1

Down 4%

Down 19.9%

With coal substitution as the core strategy, expand the use of biomass fuels, circular-resource fuels and renewable energy, continue site energy-saving measures and energy-system risk management, improve energy efficiency, and advance circular-economy initiatives and partnerships.

Significantly reduce fossil-fuel use and increase the use of renewable energy.

Average annual electricity-saving rate of 1.5%Note 2

1.5%

2.3%

Continue developing diversified green energy, improving equipment and system efficiency, and increasing the share of alternative fuels; flexibly allocate renewable energy for self-use or trading based on market demand.

Alternative energy (biomass + alternative fuels) to account for at least 35% of total energy input

At least 35%

Three business groups: 36%
Taiwan: 43.4%

Implement water circularity, continuously improve water-recycling rates at paper mills, and reduce water consumption per unit of paper.

Water-recycling rate at paper mills: at least 85%

85%

Over 90%

Strengthen water-saving measures, recover, circulate and reuse process water, and use anaerobic treatment systems to substantially reduce organic content in process effluent while developing product water-saving initiatives.

In 2025, higher production at certain sites increased process-water demand. Inflows from nearby agricultural drainage also caused greater fluctuations in water withdrawal, discharge and consumption at some sites. Water-resource management and monitoring will continue to be strengthened, including tracking external inflows.

Reduce total water consumption by 1% from the previous year

Down 1%

Up 103%

Advance the circular economy and zero waste while reducing total waste generation.

Resource recovery rate of at least 87%

At least 87%

94%

Expand the reuse of process residues as alternative fuels, convert waste into energy, and continuously increase waste reuse and recycling.

Under circular-economy principles, strengthen production controls to reduce waste from losses, increase the use of recyclable and reusable materials, redesign products for easier recovery, and track waste flows to ensure proper treatment.

Reduce direct waste disposal by 1% from the previous yearNote 3

Down 1%

Down 14%

Note 1: Data scope covers all Taiwan production sites and the parent company included in this report.
Note 2: Data scope covers major Taiwan production sites included in this report.
Note 3: Direct disposal includes waste disposed of through landfill, incineration and other treatment methods.


Environmental Investment

In 2025, YFY continued to expand investment in sustainability and environmental improvement, with annual investment reaching NT$854 million, the highest level in the past four years. Compared with NT$297 million in 2022, NT$501 million in 2023 and NT$279 million in 2024, investment in 2025 more than doubled year on year and increased by approximately 221% from 2022, reflecting a continued deepening of environmental transformation efforts.Investment priorities have also expanded from pollution prevention to energy transition and carbon reduction, including energy conservation, energy management, GHG reduction, renewable energy, water-resource management, waste recovery and ecological conservation.Going forward, the Company will continue to reduce the environmental impacts of its operations through equipment upgrades, energy-efficiency improvements and renewable-energy deployment, while strengthening the long-term competitiveness of green products and low-carbon processes.

Environmental Investment

Unit: NT$100 million

Investment Category

2022

2023

2024

2025

Included Projects

Renewable Energy / Energy Technology

0.17 4.14 1.08 0.50 Continued investment in biomass energy, biogas power generation, and solar power to expand green electricity.

Energy Efficiency / Energy Management

3.92 Implemented energy management through equipment upgrades, system-level energy-saving measures, and waste heat recovery.

Carbon Reduction / GHG Emissions Management

3.54 Improved energy efficiency and reduced emissions per unit of product.

Waste Reduction / Waste Recycling & Reuse

0.28 0.11 0.02 0.36 Promoted waste reduction, recycling, and resource recovery to reduce dependence on fossil fuels.

Water Conservation / Water Management

1.04 0.34 0.04 0.11 Capital expenditures for water treatment, including circulation pump replacement, installation of clean-water filtration systems, and expansion of water-recycling systems.

Water Pollution Control

0.11 0.05 Improved process-water recycling through white-water reuse, additional reclaimed-water disinfection equipment, and enhanced biological treatment capacity.

Air Pollution Control

1.48 0.42 1.54 0.04 Capital expenditures for air-pollution reduction and control, including new pollution-control equipment, dust-collection system upgrades, and digester-cover improvements.

Ecology / Environmental Conservation

- - - 0.02 Worked with local governments to use plant effluent that exceeds regulatory water-quality standards to support natural ecosystems and biodiversity.

Other

0.02 0.15 0.40 1.07 Capital expenditures for employee welfare and care, occupational safety and health, information security, quality management, automation, and digital transformation.

Total

2.99 5.16 3.19 9.61 -

Operating Site Coverage (%)

100 100 100 100 -


YFY Management Systems

Building on international management and certification systems, YFY continues to strengthen environmental and quality management from raw materials and manufacturing processes to products. In 2025, ISO 14001 certification coverage reached 94%, and eight production sites obtained ISO 50001 certification. The parent company and all production sites completed GHG inventories, with approximately 90% of emissions subject to third-party verification. Sustainable procurement is implemented at the raw-material stage: renewable materials accounted for 96.5% of product and packaging inputs, while FSC/PEFC certification coverage for imported pulp purchased in Taiwan reached 100%. YFY also advances energy conservation, carbon reduction and water circularity, with average water-recycling rates at paper mills exceeding 90%, while ISO 9001 quality management strengthens product consistency and sustainable value.

List of Plant Management System Certication
Site ISO 9001
Quality Management System
ISO 14001
Environmental Management System
ISO 45001
Occupational Health and Safety Management System
FSC CoC
Chain of Custody
Industrial Paper & Packaging Business Group
Xinwu 2026/07 2026/07 2028/08 2030/02
Xinwu Packaging 2026/10 2026/10 2026/10 2030/02
Taoyuan (incl. Color Box)* Taoyuan 2027/09 | Color Box 2029/05 2028/10 2028/11 2030/02
Zhunan 2028/03 2029/06 2027/03 2030/02
Dajia 2026/12 2027/01 2027/01 2030/02
Changhua 2028/08 2027/08 2028/11 2030/02
Kaohsiung 2026/10 2028/11 2028/11 2030/02
Yangzhou 2026/12 2027/01 2026/09 2030/02
Tianjin 2027/12 2027/12 2027/12 2027/12
Qingdao 2028/04 2028/04 2028/04 2028/11
Nanjing 2026/10 2028/10 2028/10 2028/08
Shanghai 2029/04 2029/04 2029/05 2029/08
Suzhou 2028/03 2028/03 2026/12 2028/04
Kunshan 2029/06 2029/06 2029/06 2028/06
Jiaxing 2027/08 2027/08 2027/03 2030/12
Fuzhou 2029/03 2029/03 2029/03 2030/06
Xiamen 2029/01 2029/01 2027/12 2030/06
Dongguan 2028/12 2028/12 2028/12 2031/03
Guangzhou 2026/08 2026/08 2026/08 2029/11
Zhongshan 2028/12 2028/12 2027/02 2028/01
Henan 2028/05 2028/05 2028/05 2029/08
Pingyang 2029/02 2029/02 2029/03 2027/09
Dong Nai 2027/03 2027/03 2027/02 2030/09
Long An 2027/03 2027/03 2027/03 2030/09
Consumer Products Business Group
Yangmei 2026/09 2028/11 2027/01 2029/07
Qingshui 2029/05 2028/03 2028/02 2029/07
Yongshengpu 2028/02 2026/10 2028/02 -
Yangzhou 2026/08 2026/08 2026/08 2030/07
Kunshan 2026/11 2026/11 2026/11 2028/01
Forestry, Pulp & Paper Business Group
Hualien 2029/05 2028/04 2027/06 2028/08
Taitung 2026/12 2028/12 2028/12 2028/10
Jiutang 2028/05 2029/06 2029/06 2027/12
Guanyin 2028/05 2028/05 - 2028/09
Dingfeng 2026/07 2026/08 - 2027/02

* The ISO 14001 certification scope covers the Taoyuan Plant only; ISO 45001 and FSC certifications cover both the Taoyuan Plant and the Color Box Plant.

Certification / Certificate
Production Sites and Validity

ISO 14064-1 / GHG Protocol / CNS 14064-1 / GHG Emissions Verification Statement (updated annually)

Jiutang, Taitung, Guanyin, Hualien, Dingfeng, Xinwu, Qingshui, Yangmei, Yongshengpu, Kunshan Household Products, Yangzhou Household Paper

ISO 14067 / Product Carbon Footprint Verification Statement Hualien Plant – Paper Star Copy Paper (2027/09); Xinwu Plant – Facing Linerboard A0/BL/B4/BM, Corrugating Medium M0, White Kraft Paper W2/W4, and Coated Duplex Board DM (2026/08); Yangmei Plant – May Flower High-Absorbency Folded Paper Towels, 200 sheets (2026/10); Yongshengpu – Orange House Natural Concentrated Antibacterial Laundry Detergent, 1800 ml (2029/05)
ISO 50001 Energy Management System Jiutang (2026/12), Taitung (2026/11), Xinwu (2027/03), Yangzhou (2027/03), Long An (2029/01), Dong Nai (2026/12), Qingshui (2027/12), Yangmei (2027/12)
PEFC Certification Hualien Plant (2025/09), Yangzhou Household Paper (2028/01)

* The ISO 14064-1 certification scope covers both the Taoyuan Plant and the Color Box Plant.


Clean Water and Santation Clean Water and Santation
Affordable and Clean Energy Affordable and Clean Energy
Responsible Consumption and Production Responsible Consumption and Production
Climate Action Climate Action
Life on Land Life on Land
Partnerships for the Goals Partnerships for the Goals

Management Policy

Management Policy

  1. Commit to taking into account environmental and ecological protection while developing the business. Regularly review regulations and trends. Continuously improve performance and management systems.
  2. Take International standards such as ISO14001, 50001,  as the management basis, and check through third-party verification and rolling corrections for continual improvement.
  3. Actively develop and support the procurement of innovative energy and material design, develop the value of resources, and improve the efficiency of resource use to enhance the competitiveness of the company

Environmental Topics

All large-scale production sites of YFY are equipped wi th dus t col lec t ion sys tems and moni tor ing equipment , which are cont inuously checked, adjusted at any time, and regularly repor ted to ensure no emissions of ozone-depleting substances (ODS) and strictly control air quality. 

The primary guidelines followed are ISO 14064-1 and the GHG Protocol. Plants in Taiwan use GWP values from IPCC AR5, whereas YFY Inc. (the parent company) and Taiwan's corrugated container plants use IPCC AR6. In Mainland China, plants use either IPCC AR6 or the "Accounting Guidelines for the Paper Industry." Scope 1 and Scope 2 emissions are reported consistently. For corrugated container plants in Mainland China, Scope 1 emissions mainly come from boilers, while the corrugated container plant in Vietnam reports only Scope 2 emissions related to electricity. Additionally, Yangzhou Plant and Dingfeng Paper Industry calculate emissions in five categories—fossil fuel combustion, process emissions, wastewater treatment, net electricity purchase, and net heat purchase—according to the "Accounting Guidelines for the Paper Industry." The first three categories are classified as Scope 1, while the latter two are Scope 2.

We uses the core elements of the Task Force on Climate-related Financial Disclosures (TCFD) as an information framework for identification and analysis to implement the GHGs reduction plan with a rigorous attitude, and contribute to the goal of global net zero carbon emissions.

Non-GHG Emissions
  Unit 2021 2022 2023 2024  2025
Nitrogen Oxides (NOx) metric tonnes 1,249 927 980 878 770
Sulfur Oxides (SOx) metric tonnes 1,221 922 704 647 649
Particulate matter (PM) metric tonnes 224 751 196 201 208
Volatile organic compounds (VOCs) metric tonnes 140 316 153 205 167
Hazardous air pollutants (HAPs) metric tonnes 0.08 0.1 0.1 0.2 0.18
data coverage   100% 100% 100% 100% 100%
*Scope of data: All production sites listed in the “Entities Covered by This Report.”
*Nitrogen oxides: Since the selected testing method is the total nitrogen oxides measurement, N2O cannot be excluded. Therefore, the NOX emissions are disclosed following local regulations and GRI 305-7 reporting requirements. *Sulfur dioxide: Since the chosen method is the total sulfur oxides measurement, SO2 cannot be measured separately. Therefore, the SOX emissions are disclosed following local regulations and GRI 305-7 reporting requirements.
*Historical data coverage has consistently been 100%. *Other air pollutants include hazardous air pollutants (HAPs) such as lead, cadmium, mercury, arsenic, hexavalent chromium, and their compounds, regulated under the Environmental Protection Administration’s “Emission Standards for Hazardous Air Pollutants from Stationary Sources.”
*Emission statistics are based on actual monitoring results from sites and pollutants with available data.

Circular Raw Materials: Extending Resource and Biogenic Carbon Value

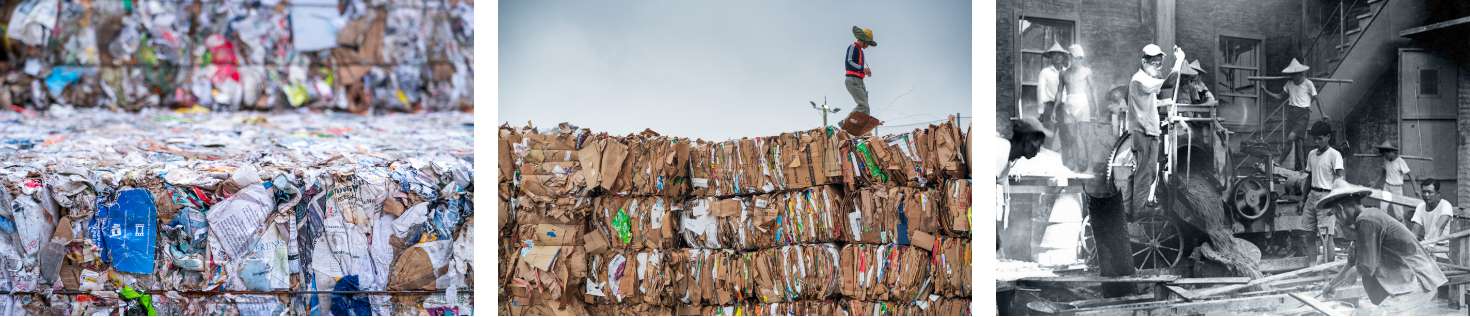
For more than a century, YFY has continued to place the circular economy at the core of its operations, promoting the sustainable use of resources from the raw-material stage. Wood chips, pulp, recovered paper, and base paper are among the Group’s principal production inputs. Through the use of recycled fibers and paper recovery, materials are repeatedly reintroduced into production processes, extending material life cycles and reducing demand for virgin resources. In 2025, 96.5% of the raw materials used in products and packaging across YFY’s three major business groups were renewable materials, of which recovered paper accounted for 36.2%. In the Containerboard and Packaging Business Group, more than 90% of the raw materials used in pulp production were sourced from recovered paper. By continuously strengthening paper-fiber circularity, YFY extends the value of biogenic carbon stored in fibers throughout the product life cycle.

Responsible Procurement: Building a Traceable and Sustainable Forest Supply Chain

YFY strengthens upstream raw-material governance through responsible procurement and traceability management, giving priority to raw materials verified by independent third parties and applying forest certification schemes such as FSC and PEFC to reduce risks associated with forest conversion and natural-resource use. In 2025, 95% of the raw materials procured by YFY were sourced from FSC- or PEFC-certified sources. Within CHP’s Taiwan operations, 95.71% of purchased wood chips were certified, while certification coverage for imported pulp reached 100%. During the same year, green procurement of raw materials reached NT$10.3 billion, accounting for approximately 55% of total raw-material procurement, while the Group continued to explore opportunities to expand local sourcing. In addition, the Forestry, Pulp and Paper Business Group manages more than 30,000 hectares of plantation forests across Taiwan and China and continues to advance sustainable forestry practices and FSC Forest Management Certification. Through supplier no-deforestation requirements, certified raw-material procurement, and supply-chain traceability, YFY seeks to protect forests, biodiversity, and natural capital from the source.

To support sustainable consumption and production, YFY recognizes that responsible raw-material management is essential to maintaining long-term, circular, and sustainable operations. The Group gives priority to environmentally preferable products for raw materials, facility operations, and office supplies, including products carrying environmental labels, energy-efficiency labels, and FSC certification. In 2025, 95% of the raw materials procured by YFY were sourced from FSC- or PEFC-certified sources. In line with its green procurement principles, annual procurement of recycled fiber amounted to NT$10.3 billion, representing 55% of total procurement expenditure. Procurement practices are primarily aligned with each business group’s commitments to the use of recycled fibers and internationally certified materials, the production of green products, and customer and consumer requirements, while appropriate risk controls are implemented throughout the process.

Maintaining Stable Circular Use of Key Paper-Fiber Raw Materials and Improving Resource Efficiency

Recent trends in the use of key paper-fiber raw materials show that YFY’s consumption of virgin pulp/wood chips, recovered paper, and base paper for corrugated packaging has generally increased since 2022, with continued growth in 2023 and 2024 alongside business expansion. In 2025, total consumption of these three major raw-material categories was approximately 4.055 million metric tons, representing a slight decrease of approximately 1.7% from 2024, while the overall material mix remained stable. Recovered paper remained the largest category in 2025 at approximately 1.649 million metric tons, accounting for around 40.7% of the three major raw materials. Virgin pulp/wood chips accounted for approximately 1.224 million metric tons, while base paper for corrugated packaging accounted for approximately 1.183 million metric tons. By continuing to increase the use of recycled fibers, certified raw materials, and renewable materials, YFY is able to meet production needs while reducing reliance on virgin resources and improving overall material circularity.

Historical Use of Major Fiber-Based Raw Materials
Materials Unit 2022 2023 2024
2025
Raw Wood Pulp/Chips metric tonnes 692,419 1,271,755 1,313,312 1,223,730
Recycled Paper metric tonnes
1,460,045 1,646,731 1,667,286 1,648,658
Containerboard Paper for Packaging metric tonnes 814,984 930,807 1,146,303 1,183,110
Total metric tonnes 2,967,448 3,849,293 4,126,901 4,055,498


Greenhouse Gas Management

As the global transition to net zero accelerates, carbon pricing mechanisms expand, and Taiwan progressively implements carbon fees and emissions-control policies, greenhouse gas management has evolved from an environmental issue into a key business consideration affecting operating costs, capital allocation, energy strategy, and supply-chain competitiveness. YFY continues to monitor carbon emissions across its operating sites through GHG inventories, energy transition, process improvements, and digital carbon management. In line with its voluntary carbon-fee reduction plans and net-zero transition pathway, YFY has established short-, medium-, and long-term reduction targets, progressively decoupling production growth from carbon emissions and advancing toward net-zero emissions by 2050.

YFY Greenhouse Gas Reduction Strategy

YFY advances GHG reductions through three strategic pillars: “Energy Structure, Process Optimization, and Transformation & R&D.” Under Energy Structure, YFY continues to expand the use of biomass fuels and circular-resource fuels to reduce reliance on fossil fuels, while investing in renewable energy such as biomass energy, biogas power generation, and solar power. Process Optimization focuses on equipment replacement and upgrades, system-level energy efficiency, waste-heat recovery, and productivity improvements to reduce energy consumption and emissions per unit of product. Under Transformation & R&D, YFY is introducing AI-enabled and digital management, renewable-energy and energy-storage systems, and carbon management accounts to monitor emissions at sites and production lines in real time. The Company is also advancing carbohydrate-based low-carbon materials, voluntary emissions-reduction projects, afforestation carbon-credit initiatives, and artificial-wetland reduction methodologies, while incorporating internal carbon pricing into low-carbon transition management.


Energy Structure

Process Optimization

Transformation & R&D

Alternative Fuels Renewable Electricity Development Energy Efficiency & Equipment Replacement Production Optimization Digital Intelligence Materials Innovation Market Participation
  • Expand the use of biomass-based alternative fuels and circular-resource fuels.
  • Promote waste recovery and reduction to reduce dependence on fossil fuels.

Continue investing in biomass energy, biogas power generation, and solar power to expand renewable electricity.

Strengthen energy management through equipment replacement and upgrades, system-level efficiency measures, and waste-heat recovery to reduce equipment energy consumption, improve energy efficiency, and lower emissions per unit of product.

  • Optimize the product mix and production-capacity allocation to improve production efficiency.
  • Invest in innovative low-carbon technologies to advance green and low-carbon production.
  • Introduce digital and AI-enabled management to improve production efficiency and product yield.
  • Deploy renewable-energy and energy-storage systems and participate in Taipower’s Supplemental Reserve Program to strengthen power-supply stability.
  • Establish carbon management accounts integrated with automated equipment to enable digital, real-time monitoring of carbon emissions across sites and production lines.

Develop diverse innovative paper-based materials and expand applications of carbohydrate-based materials.

  • Implement voluntary emissions-reduction projects, advance a Taiwan demonstration afforestation carbon-credit project, and develop an artificial-wetland emissions-reduction methodology.
  • Continue monitoring domestic and international trends and regulatory developments, while implementing internal carbon pricing.


Greenhouse Gas Reduction Pathway

In response to Taiwan’s carbon fee system, in 2025 YFY had seven entities subject to carbon fees in Taiwan, accounting for approximately 97% of YFY’s total emissions in Taiwan. All seven entities submitted voluntary reduction plans for 2025–2030. Following review by the competent authority, two plants were approved for Preferential Rate A and five plants for Preferential Rate B, and all received carbon-fee preferential treatment for industries at high risk of carbon leakage. Key decarbonization measures include switching to low-carbon and biomass fuels, replacing and upgrading equipment, improving energy efficiency, introducing renewable energy such as solar power, and optimizing compressed-air, paper-machine, and steam systems.

In accordance with the designated GHG reduction targets for entities subject to carbon fees, YFY uses 2021 as the baseline year for its carbon-fee voluntary reduction plans; combined Scope 1 and Scope 2 emissions across Taiwan, mainland China, and Vietnam were approximately 2.574 million metric tons CO₂e. Based on the commitments in each plant’s voluntary reduction plan, YFY has set targets to achieve a 16% reduction from the baseline year by 2030, a 50% reduction by 2040, and alignment with the national net-zero target by 2050

Metric tons CO2e


2030 vs.
202116% reduction
-16%
 
 
2040 vs.
202150% reduction
-50%
 
 
2050Net-Zero Emissions
Net Zero
2021
Baseline Year
2030
Short-Term Target
2040
Medium-Term Target
2050
Long-Term Target

Greenhouse Gas Emissions Trends and Reduction Performance

YFY defines its GHG inventory boundary using the operational control approach. Production sites across its three major business groups conduct annual GHG inventories in accordance with ISO 14064-1, the GHG Protocol, or applicable local requirements. The parent company, YFY Inc. (Head Office), introduced GHG inventory and verification in 2023 and completed the first-year GHG inventory for all consolidated subsidiaries in 2025, progressively establishing a carbon management foundation aligned with the financial reporting boundary.

In 2025, Scope 1 and Scope 2 emissions from the three major business groups across Taiwan, mainland China, and Vietnam totaled approximately 2.33 million metric tons CO₂e, a 9.5% decrease from 2021. Scope 1 emissions decreased by 3.3% from 2024, mainly due to reduced coal use, increased use of alternative fuels and biomass energy, and transformation projects at selected sites. Market-based Scope 2 emissions remained broadly stable year on year.

Greenhouse Gas Emissions (Scopes 1+2)
Unit: tCO2e 2021 2022 2023 2024 2025
Scope 1 2,204,727 1,971,683 2,128,176 2,064,887 1,996,267
Scope 2 (Location Based) 369,564 429,658 366,429 332,245 332,069
Scope 2 (Market Based) 369,564 429,658 366,429 332,245 334,407
Total (Location Based) 2,574,291 2,401,341 2,494,605 2,379,132 2,328,336
Total (Market Based) 2,574,291 2,401,341 2,494,605 2,379,132 2,330,674
Data coverage (% of production sites) 97.1% 100% 100% 100% 100%

* Data Scope: Parent company (YFY Inc.) and all production sites listed in the “Entities Included in the Report.”

* Explanation of Emission Calculation:

- Methodology: Primarily follows ISO 14064-1 and the GHG Protocol; however, Yangzhou Plant adopts the “Accounting Guidelines for the Paper Industry” issued by China’s National Development and Reform Commission.

- Scopes: Disclosures are standardized to include Scope 1 and Scope 2. According to the Accounting Guidelines for the Paper Industry, Yangzhou Plant calculates five emission sources: fossil fuel combustion, industrial processes, wastewater treatment, net purchased electricity, and net purchased steam. The first three fall under Scope 1, while the latter two are classified under Scope 2.

- GWP Values: Parent Company adopts IPCC AR6, Taiwan plants adopt IPCC AR5 or AR6, mainland China plants adopt IPCC AR6 or Accounting Guidelines for the Paper Industry, and Vietnam plants adopt IPCC AR6.

* The Scope 2 location-based emissions for mainland China plants are estimated using the 2024 national average electricity carbon footprint factor of 0.5777 kgCO2e/kWh released by the Ministry of Ecology and Environment.

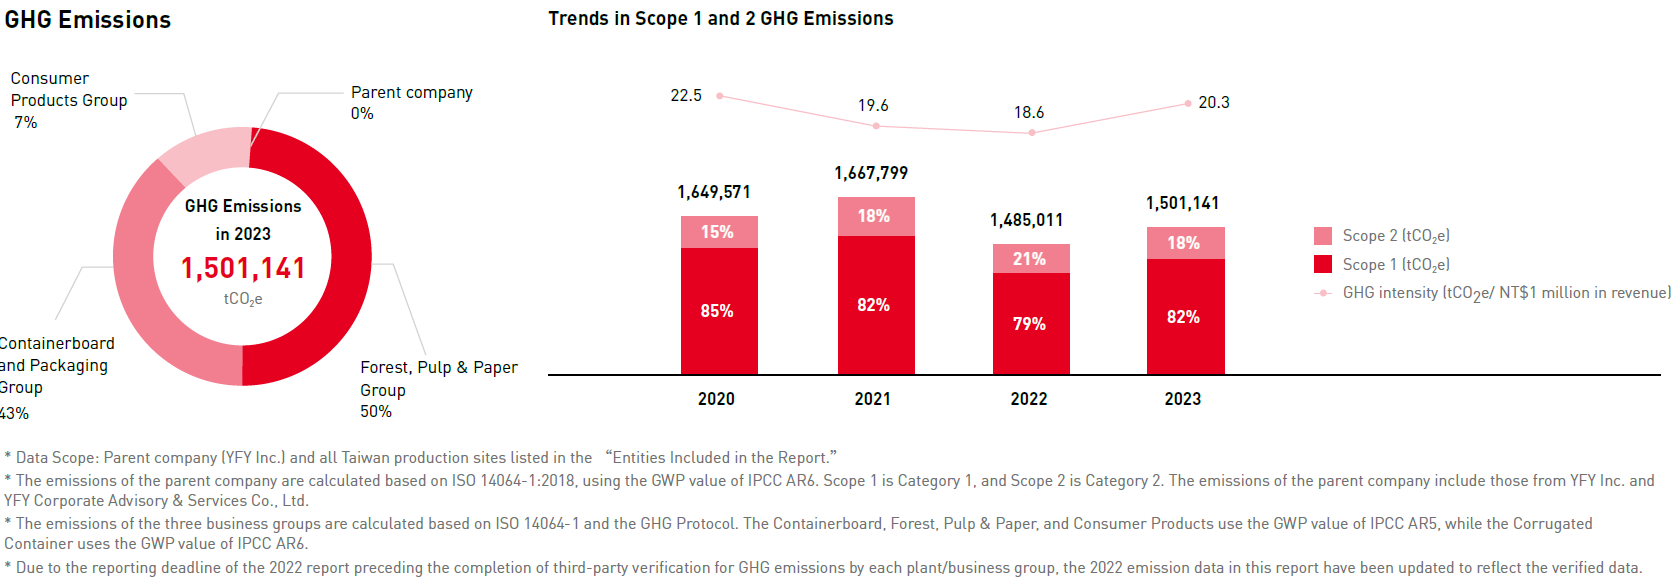
Of this total, Scope 1 and Scope 2 emissions in Taiwan totaled 1.336 million metric tons CO₂e in 2025, down 19.9% from 2021 and 5.1% from 2024; Scope 1 emissions were approximately 1.101 million metric tons CO₂e, accounting for about 82% of Taiwan emissions. With increased use of alternative fuels and biomass energy, Taiwan Scope 1 emissions in 2025 were 19.5% lower than in 2021; biogenic emissions totaled 753,000 metric tons CO₂e.

Historical Scope 1 and Scope 2 GHG Emissions (Taiwan)

19.6
18.6
20.3
18.0
18.1


1,667,799
18%
82%
2021
1,485,011
21%
79%
2022
1,501,141
18%
82%
2023
1,408,093
18%
82%
2024
1,336,181
18%
82%
2025
 
Scope 2 (metric tons CO2e)
Scope 1 (metric tons CO2e)
GHG Emissions Intensity per Unit Revenue
(metric tons CO2e / NT$ million revenue)

2025 GHG Emissions (Taiwan)

Consumer Products Group
 
Parent Company 0%
 
1,336,181
Metric tons CO2e
53%
40%
7%
Containerboard and Packaging
Group
 
Forest, Pulp & Paper
Group


In 2025, GHG emissions intensity across YFY’s major product categories was generally stable or declining, reflecting the gradual benefits of improved energy efficiency, low-carbon fuel adoption, and process optimization. Consumer Products recorded the most notable improvement, with emissions intensity decreasing by approximately 33%, from 1.29 in 2021 to 0.87 in 2025. Containerboard also declined by approximately 18%, from 0.99 to 0.81. Fine Paper decreased from 1.36 to 1.19, maintaining a long-term downward trend. Although Pulp emissions intensity remained above the 2021 level, it fell from 0.81 in both 2023 and 2024 to 0.77 in 2025. Corrugated Packaging remained stable at approximately 0.10. Overall, YFY continues to reduce carbon emissions intensity per unit of product through process improvements and energy transition.

GHG Emissions Intensity (metric tonnes CO₂e/ metric tonnes product)
Product 2021 2022 2023 2024 2025
Pulp 0.57 0.64 0.81 0.81 0.77
Fine Paper 1.36 1.27 1.05 1.20 1.19
Consumer Products 1.29 1.18 1.17 1.06 0.87
Containerboard 0.99 0.93 0.90 0.82 0.81
Corrugated Packaging 0.10 0.10 0.09 0.10 0.10

* The data scope includes Scope 1 and Scope 2 emissions from all production sites of the Pulp & Paper Business Group (excluding Guanyin) and the Containerboard & Packaging Business Group covered in this report, as well as the Taiwan production sites of the Consumer Products Business Group.

Strengthening Value Chain Carbon Management and Expanding Scope 3 Inventory Coverage

 Since 2024, YFY has progressively established a Group-wide Scope 3 GHG inventory mechanism, extending carbon management from Scope 1 and Scope 2 to the upstream and downstream value chain. In 2025, YFY further expanded its domestic inventory boundary by including additional paper mills of selected Taiwan subsidiaries, improving the completeness of value-chain emissions data. Scope 3 emissions totaled approximately 1.224 million metric tons CO₂e in 2025. Purchased Goods and Services accounted for approximately 905,000 metric tons, or about 74%; Fuel- and Energy-Related Activities accounted for approximately 194,000 metric tons, or about 16%; and Upstream Transportation and Distribution accounted for approximately 80,000 metric tons, or about 6.5%. YFY will continue to expand inventory coverage and advance supply-chain decarbonization targeting major emissions hotspots in raw materials, energy, and logistics.

2025 Greenhouse Gas Emissions Scope 3
Organizational Scope Inventory
Year
Scope 3 Category Emissions
(metric tons CO2e)
YFY Inc. (Head Office)Note 1 2025 Category 4.1: Purchased Goods – Electricity / FuelsNote 2 9
Subtotal 9
Material Listed Subsidiaries Included in the Consolidated Financial StatementsNotes 3, 4 2025 Category 1: Purchased Goods and Services 904,924
Category 2: Capital Goods 8,250
Category 3: Fuel- and Energy-Related Activities (Not Included in Scope 1 or Scope 2) 194,427
Category 4: Upstream Transportation and Distribution 79,753
Category 5: Waste Generated in Operations 5,586
Category 6: Business Travel 123
Category 7: Employee Commuting 700
Category 8: Upstream Leased Assets 1,394
Category 9: Downstream Transportation and Distribution 10,909
Category 10: Processing of Sold Products -
Category 11: Use of Sold Products -
Category 12: End-of-Life Treatment of Sold Products 16,851
Category 13: Downstream Leased Assets 920
Category 14: Franchises -
Category 15: Investments 611
Subtotal 1,224,448
    Total 1,224,457

Note 1 Data scope: YFY Inc. (Head Office).

Note 2 Scope 3 emissions are disclosed in accordance with ISO 14064-1:2018 and the materiality criteria, and are subject to assurance by BSI in accordance with ISO 14064-3. When emissions from consolidated subsidiaries are aggregated, they are classified as GHG Protocol Scope 3 Category 3.

Note 3 Data scope: Chung Hwa Pulp Corporation; YFY Packaging Inc. – Xinwu Plant; YFY Consumer Products Co., Ltd.; Ever Growing Agriculture Biotech Co., Ltd.; and YFY Corporate Advisory & Services Co., Ltd.

Note 4 Scope 3 emissions are disclosed by category in accordance with the GHG Protocol.

Internal Carbon Pricing

YFY is progressively incorporating carbon costs into corporate investment and capital-allocation decisions. Internal carbon pricing is calculated based on the estimated costs required for each plant’s decarbonization measures, including initial investment, subsequent operation and maintenance expenses, and the expected cumulative Scope 1 and Scope 2 emissions reductions, to derive the abatement cost per metric ton of GHG emissions reduced. The Company applies a Shadow Price mechanism, incorporating a carbon price into investment assessments and capital-expenditure decisions. The mechanism is prioritized for listed subsidiaries that are significant emissions sources and serves as an evaluation metric for new investment projects and related capital expenditures.

By translating carbon-reduction benefits into financial value and combining them with payback period (PBP) and investment-benefit assessments, YFY can compare the effectiveness of different energy-efficiency, process-improvement, renewable-energy, and low-carbon technology projects, guiding capital allocation toward low-carbon transition. Based on the consolidated financial reporting boundary, combined Scope 1 and Scope 2 emissions were approximately 2.487 million metric tons CO₂e in 2024 and decreased to approximately 2.409 million metric tons CO₂e in 2025, a 3.1% reduction from the baseline year. The Company uses 2024 as the emissions-reduction baseline year for this reporting boundary and has set targets to achieve a 2% reduction by 2026, a 22% reduction by 2035, a 50% reduction by 2040, and net-zero emissions by 2050

YFY's global large-scale production bases and main operating bases are equipped with different green energy equipment, including biogas, lignin, waste-derived fuels, etc.We continue to invest in research, from biomass fuels that conform to the concept of circular economy to the use of alternative fuels, gradually reduce the proportion of fossil fuels.

Respond to Global Energy Initiatives, Aligning with Global Standards

YFY joined the RE100 initiative in 2023, becoming the first representative from the global paper industry to declare its commitment to achieving 100% renewable electricity by 2040 and net-zero emissions by 2050. On our RE pathway, we regularly review energy saving and carbon reduction performance. We develop diversified green energy at our operation sites, including solar photovoltaic systems and biomass energy, such as biogas power generation, lignin power generation, and biomass fuels, leveraging industry advantages.

From "Manufacturing" to "Intelligent Manufacturing": YFY and CHP's Integrated AI Team Honored with Harvard Business Review’s Digital Transformation Dingge Award

Since adopting digital transformation and AVM, Jiutang plant has boosted production efficiency by about 2.16%, raising paper machine operating rates from 80% to 94%. This has led to a reduction of 6,000 metric tons of carbon emissions within a year. Moving forward, YFY plans to extend AVM technology to other production sites. Beyond paper production, the technology can also be applied to the production processes of various related industries, enhancing power generation efficiency, improving water treatment quality, and optimizing microgrid energy management. YFY aims to develop AVM applications as a strategic tool to further strengthen operational capabilities.

Low-carbon energy transition: Increasing the use of alternative fuels

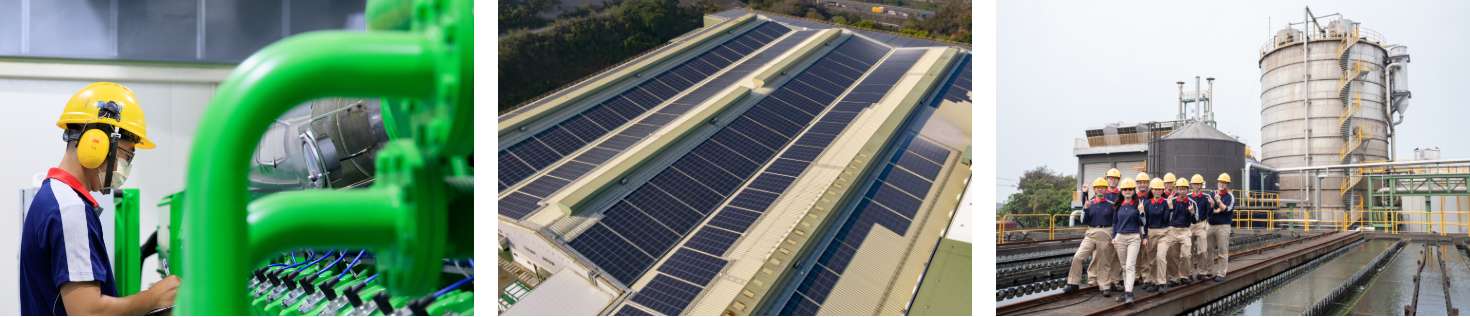
What sets the paper industry apart from others is its circular economy process, which creates a renewable energy cycle. Surplus materials from the process are converted into alternative fuels for power and steam generation. To reduce the organic content in water recycling treatment, biogas produced by an anaerobic system is used to generate electricity. This cycle not only meets plant energy needs but also lessens reliance on fossil fuels and addresses waste issues, making it a unique example of energy self-sufficiency in manufacturing. In addition to biomass energy, YFY has invested in solar energy. All qualified plants have completed solar photovoltaic installations that meet MOEA’s requirements for energy-intensive industries. In 2023, these installations were progressively converted to self-consumption, and we applied for renewable energy certificates accordingly. Total photovoltaic power generation exceeded 4.2 million kWh in 2023, with nearly 20% used for self-consumption.

Venturing into energy storage: Taiwan's first cogeneration behind-the-meter energy storage system

In 2023, Ensilience, a YFY subsidiary, and CHP jointly developed Taiwan's first "cogeneration behind-the-meter energy storage system," with a total capacity exceeding 5 MWh. The auxiliary service of the system allows clients to manage energy storage independently by charging during off-peak hours, reducing reliance on Taipower during peak times. This approach alleviates pressure on the grid, lowers plant energy demand, and enables cogeneration units to participate in Taipower's auxiliary services, benefiting both the client and Taipower.

Energy Consumption
Total energy consumption Unit 2022 2023 2024 2025
Total non- renewable energy consumption MWh 7,617,221 7,686,521 7,188,333 6,882,283
Total non- renewable energy consumption GJ 27,421,975 27,671,452 25,877,977 24,776,199
Total renewable energy consumption MWh 2,506,711 2,374,543 2,495,838 2,541,383
Total renewable energy consumption GJ 9,024,152 8,548,349 8,985,009 9,148,972
Data coverage percentage  100 100 100
100
Energy density of YFY's main products
產品別   2021 2022 2023 2024
Pulp and Fine Paper Products gigajoule per metric tons of total product 25 25.7 20 20.94
Household Paper gigajoule per metric tons of total product 12.5 13.11 12.60 12.74
Containerboard gigajoule per metric tons of total product 10.93 10.74 10.96 9.74
Corrugated Packaging gigajoule per thousand square meters of total product 0.87 1.01 1.22 0.93

* Data Scope: All production sites of the Forest, Pulp & Paper Group and the Containerboard and Packaging Group, and the Taiwan production sites of the Consumer Products Group listed in the “Entities Included in the Report.”

Water Risk Management Programs

YFY has a water risk management program that recognizes operational dependency on freshwater and screens sites via WRI Aqueduct; manages impact through controls beyond legal limits and two-stage discharge; evaluates future quantity/quality risks with monitoring/early-warning; considers stakeholder impacts and transparency; and assesses local regulatory changes including permits.

Dependency-related water risks considered in risk assessment

High operational dependency on freshwater

Paper-making relies on water as a process medium; supply interruptions can halt production, so dependency is explicitly acknowledged in strategy and targets. YFY monitors legal groundwater wells (dynamic/static levels) to maintain safe aquifers.

Portfolio screening for basin stress (TCFD-aligned)

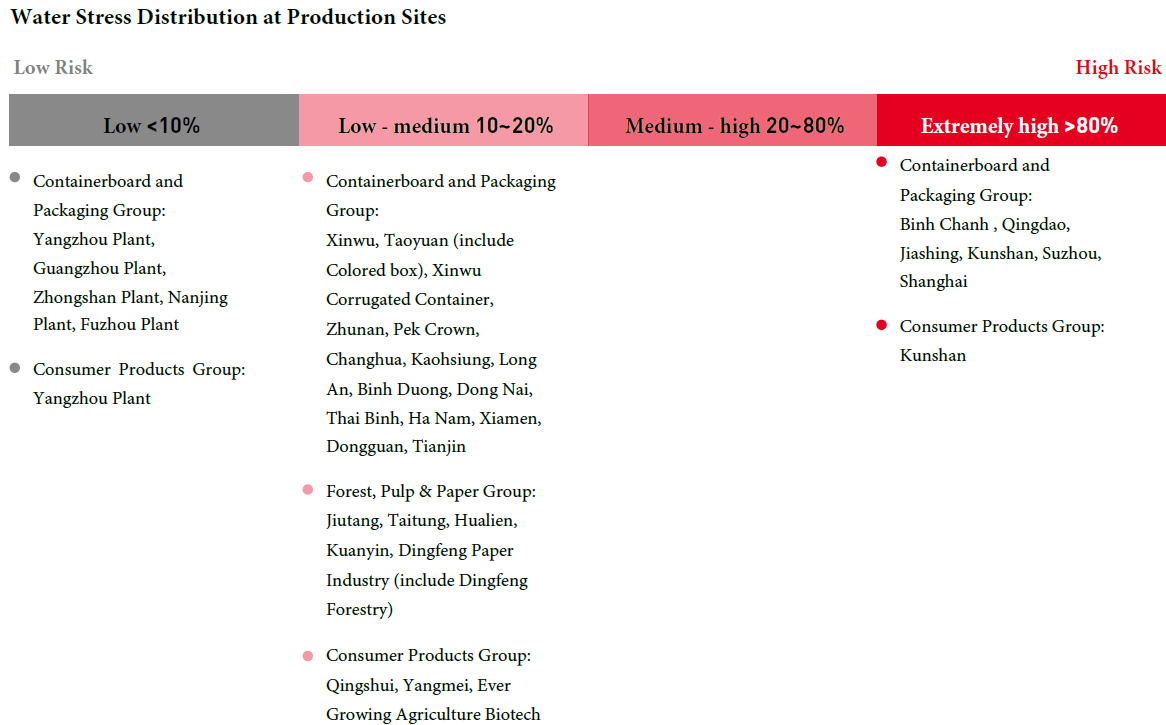
Sites are screened with WRI Aqueduct; seven sites (all corrugated) are projected under SSP1-RCP2.6 to face extremely high water stress by 2030.

Climate physical risks linked to water 

The risk register includes drought/water shortage and continuous rainfall/flooding with financial impact pathways.

Impact-related water risks considered in risk assessment

Effluent quality/receiving-environment risk

All sites meet local standards and set internal limits stricter than legal; design/operations consider receiving water bodies, with hydrology records showing no adverse impact.

Process/endpoint controls 

Upstream controls, coagulation-sedimentation and biological treatment; white-water recycling reduces load/chemicals.

Regulatory compliance risk

We note tightening water-pollution controls and potential fines/treatment costs if non-compliant.

Assessment of future water quantities available

Forward-looking basin stress (2030)

Under Aqueduct projections, seven sites face extremely high stress; these sites are in regulated industrial parks with municipal supply planning and together account for ~0.28% withdrawals / 2.42% consumption of the Group.

Assessment of future water quality-related risks

Early-warning & real-time monitoring 

YFY runs online monitoring for process/discharge, public real-time disclosure, alerting and emergency shutdown protocols—explicitly framed as critical under intensifying climate hazards (typhoon/earthquake).

Two-stage discharge pathway 

On-site treatment to exceed legal standards → industrial-park treatment → discharge to natural water bodies; hydrology records show no adverse impact.

Assessment of impacts on local stakeholders

Transparency & community interface 

YFY publicly discloses real-time water quality and operates wetland programs where treated effluent supports habitat (e.g., Old Railway Bridge Constructed Wetland), with community volunteering.

Stakeholder concern recognized in risk map 

“Stakeholder concerns or negative feedback” is tracked with mitigation (water/energy saving plans and communication).

Assessment of future potential regulatory changes at a local level

Permitting/tariff/compliance tightening 

Chung Hwa Pulp, a YFY subsidiary, identifies increased difficulty obtaining withdrawal permits, rising water costs, and stricter pollution control as medium-term, likely risks with financial effects.


Maximizing Water Value Through Responsible Management

In order to uphold the concept of maximizing the value of water resources, also ensure that products can meet quality and safety requirements of customers, YFY takes water prudently; monitors, evaluates and analyzes water carefully; and discharges appropriately.

We trace upstream and innovate such as the development of low water consumption products, online recycling and the deployment of back-end water treatment technologies that we can use recycled water to replace clean water. According to the annual report to the Water Resources Department of the Ministry of Economic Affairs, the water reuse rate of YFY process in 2023 was more than to 90%. Additionally, the Yangzhou plant of the Containerboard and Packaging Group has implemented a rainwater recycling system to convert rainwater into renewable resources, promoting water reuse. In 2023, this system saved about 133 million liters of water and nearly 300,000 RMB in sewage treatment costs.

Most of our productions bases are located in non-protected areas and non-agricultural areas with abundant water. But In the face of extreme conditions of climate change, and according to the risk and opportunity assessment and control system of ISO14001, the water management and control standards from our plants are all superior to the laws and regulations. 

Water Consumption
  Unit 2022 2023 2024 2025
Withdrawal - Tap Water million cubic meters 0.662 0.634 0.655
0.666
Withdrawal - Surface Water million cubic meters 13.315 13.457 14.016 14.583
Withdrawal - Groundwater million cubic meters 30.875 30.587 30.918 
32.007
a.Total Withdrawal million cubic meters 44.852 44.678 45.589
47.255
b.Total Discharge million cubic meters 40.348 41.422 43.479
42.968
Total net fresh water consumption (a-b) million cubic meters 4.504 3.256 2.110
4.287

*Data scope: Taiwan-based production sites of the entities covered by this Report.*Total water discharge includes effluent discharged directly and wastewater discharged to industrial park wastewater treatment facilities.*Effluent discharge standards for each plant are established in accordance with the Effluent Standards promulgated by the Ministry of Environment and the applicable wastewater acceptance standards of each industrial park.

By 2030, it is projected that seven sites will be in areas with extremely high water stress (>80%). These sites are all corrugated container plants, which have significantly lower water withdrawal and consumption compared to paper plants. They are situated in industrial zones carefully planned by local governments, with water usage precisely aligned with these plans. The process effluent is treated on-site to exceed regulatory standards, then further treated by the industrial zone's sewage system before being discharged into natural water bodies. Under strict management, water withdrawal and consumption at these sites account for only 0.3% and 1.4% of YFY's total, respectively, demonstrating extremely low usage.

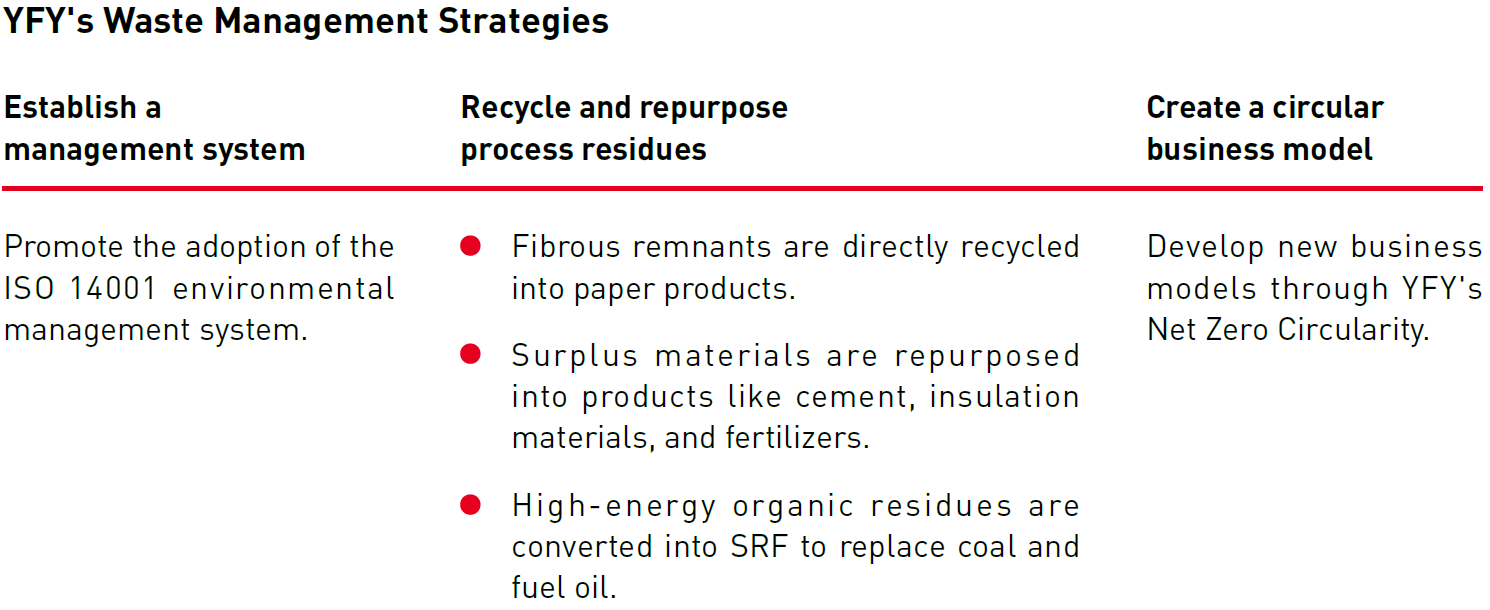
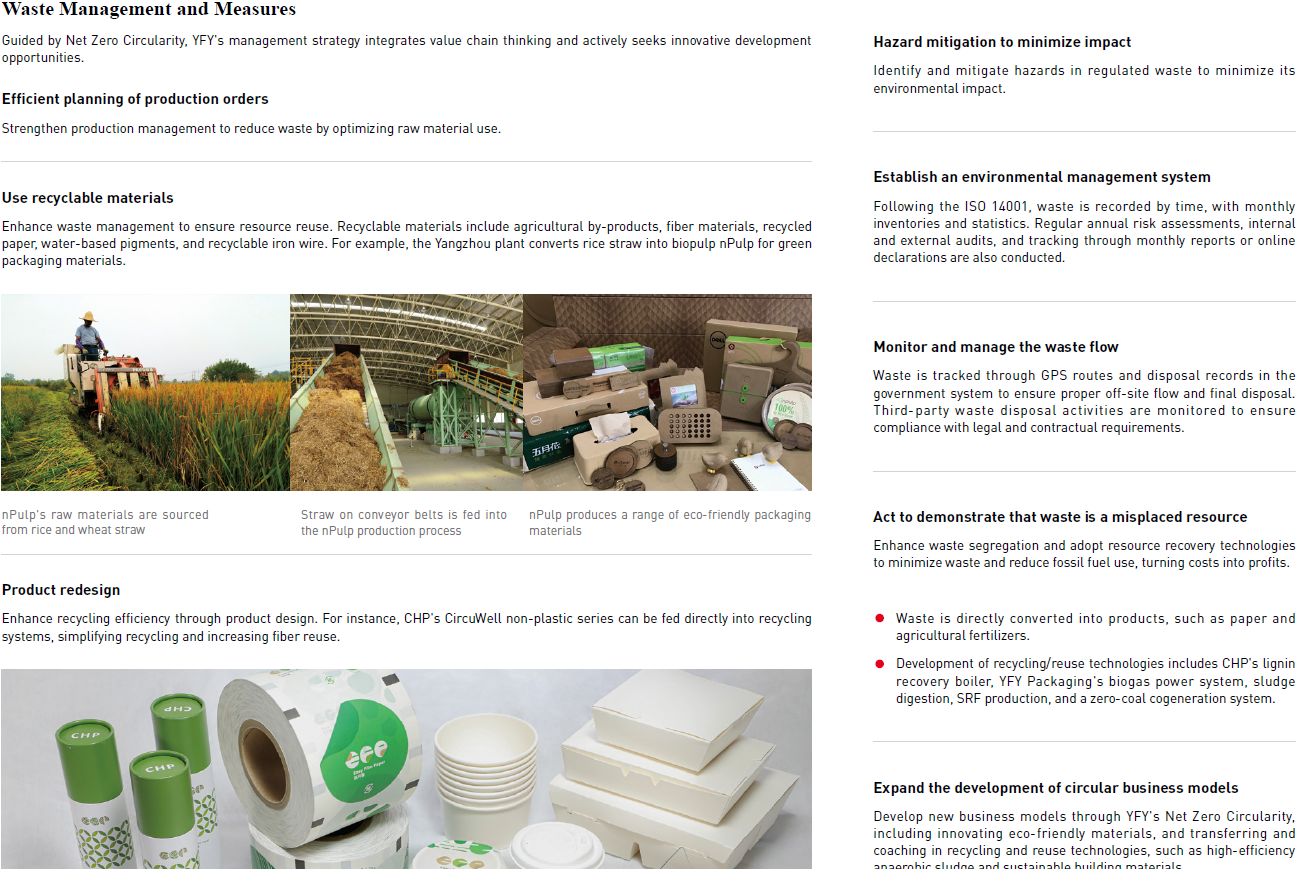
Starting with agricultural and forestry surplus materials for building materials and papermaking, YFY has embraced zero waste to create a sustainable circular economy. This approach optimizes the use of surplus materials, by-products, and energy resources throughout the value chain, finding new applications. We have developed three key waste management strategies, aiming for a 95% waste-to-resource ratio by 2030, and are committed to reducing outsourced waste by 1% annually compared to the previous year.

Waste is prioritized for recycling, reuse, or incineration with energy recovery. Only waste that cannot be repurposed is incinerated without energy recovery or sent to landfills. In 2023, although total waste generated increased, repurposed waste also rose by 6.6% from the previous year. Waste repurposing includes 43% reused, 34% incinerated with energy recovery, and 17% recycled into paper products, achieving a 93.3% waste-to-resource ratio.

Composition of the waste( Unit: metric tonnes)
 
2022 2023 2024 2025
Non-Hazardous Slag (Light Slag/Trim Waste + Heavy Slag) 167,181
175,862
184,361 181,296
Non-Hazardous Residual Sludge 208,917
198,545
206,088 204,043
Non-Hazardous Incineration Ash (Fly Ash + Bottom Ash) 154,573
182,977
185,808 176,688
Other Non-Hazardous Waste 6,703
5,060
5,800 7,218
Hazardous Industrial Waste 369
764
385.6 343
Total Waste Generated 537,743
563,208
582,443 569,588


Waste Treatment Methods
Waste Diverted from and Directed to Disposal by Treatment Method* (Unit: metric tons)
2022 2023 2024 2025
Total Waste Diverted from Disposal 493,051 525,371 539,380 534,879
- Preparation for Reuse (Converted into Paper Products) 0 0
0 0
- Recycling 493,051 525,371
539,380 534,879
Total Waste Directed to Disposal 44,466 37,837 40,362 34,709
- Landfilling 569 534 707 601
- Incineration (with Energy Recovery) 0 0
0 0
- Incineration (without Energy Recovery) 30,163 27,427
30,225 25,514
- Other Disposal Operations 13,734 9,876
9,430 8,594
- Unknown Disposal Operations 0 0 0 0
Data Coverage Rate
100% 100% 100% 100%
*The scope of data covers all production sites of the entities covered by this Report.
*Following a review of waste treatment classifications and terminology, the presentation of waste treatment categories was revised beginning in 2025.
“Preparation for Reuse” corresponds to the “Reuse” category reported in the previous year, while “Recycling” represents the aggregate of the previous year's “Reuse,” “Recycling,” and “Production of Alternative Fuels” categories.
In addition, in accordance with the requirements of GRI 306, “Incineration” has been further classified into “Incineration (with Energy Recovery)” and “Incineration (without Energy Recovery).”
“Incineration (without Energy Recovery)” corresponds to the “Incineration” category reported in the previous year.
*In line with the revised treatment categories, the formula for the resource recovery rate has also been updated as follows:
Resource Recovery Rate = (Preparation for Reuse + Recycling) / Total Waste Generated.
*Notes on the classification of waste diverted from disposal and directed to disposal:
1. Recycling operations include recycling waste into paper or other products; reuse following solidification or physical treatment, such as use as raw materials for cement, cement products,
thermal insulation materials, or fertilizers; and production of alternative fuels.
2. Other disposal operations refer to waste managed by third-party organizations through recycling or centrally treated by licensed third-party waste disposal organizations.